
4

Centos 系统简单排查流量异常问题
source link: https://hxd.life/2021/09/10/centos-%E7%B3%BB%E7%BB%9F%E7%AE%80%E5%8D%95%E6%8E%92%E6%9F%A5%E6%B5%81%E9%87%8F%E5%BC%82%E5%B8%B8%E9%97%AE%E9%A2%98/
Go to the source link to view the article. You can view the picture content, updated content and better typesetting reading experience. If the link is broken, please click the button below to view the snapshot at that time.

Centos 系统简单排查流量异常问题
主要起因是服务器出现了流量异常,感觉也没操作什么,突然的流量异常,一点不科学,就简单排查了一下,记录个笔记
第一步:找到哪个端口产生的异常流量
需要提前安装 iftop 这个工具,用来分析网络实时流量。Mac 系统下可能需要 iftop -i en0 指定网卡,然后进入界面后 p 键打开展示端口。更多精确参数和使用,参考 iftop 流量监控
centos 下直接用命令就行
iftop -PB
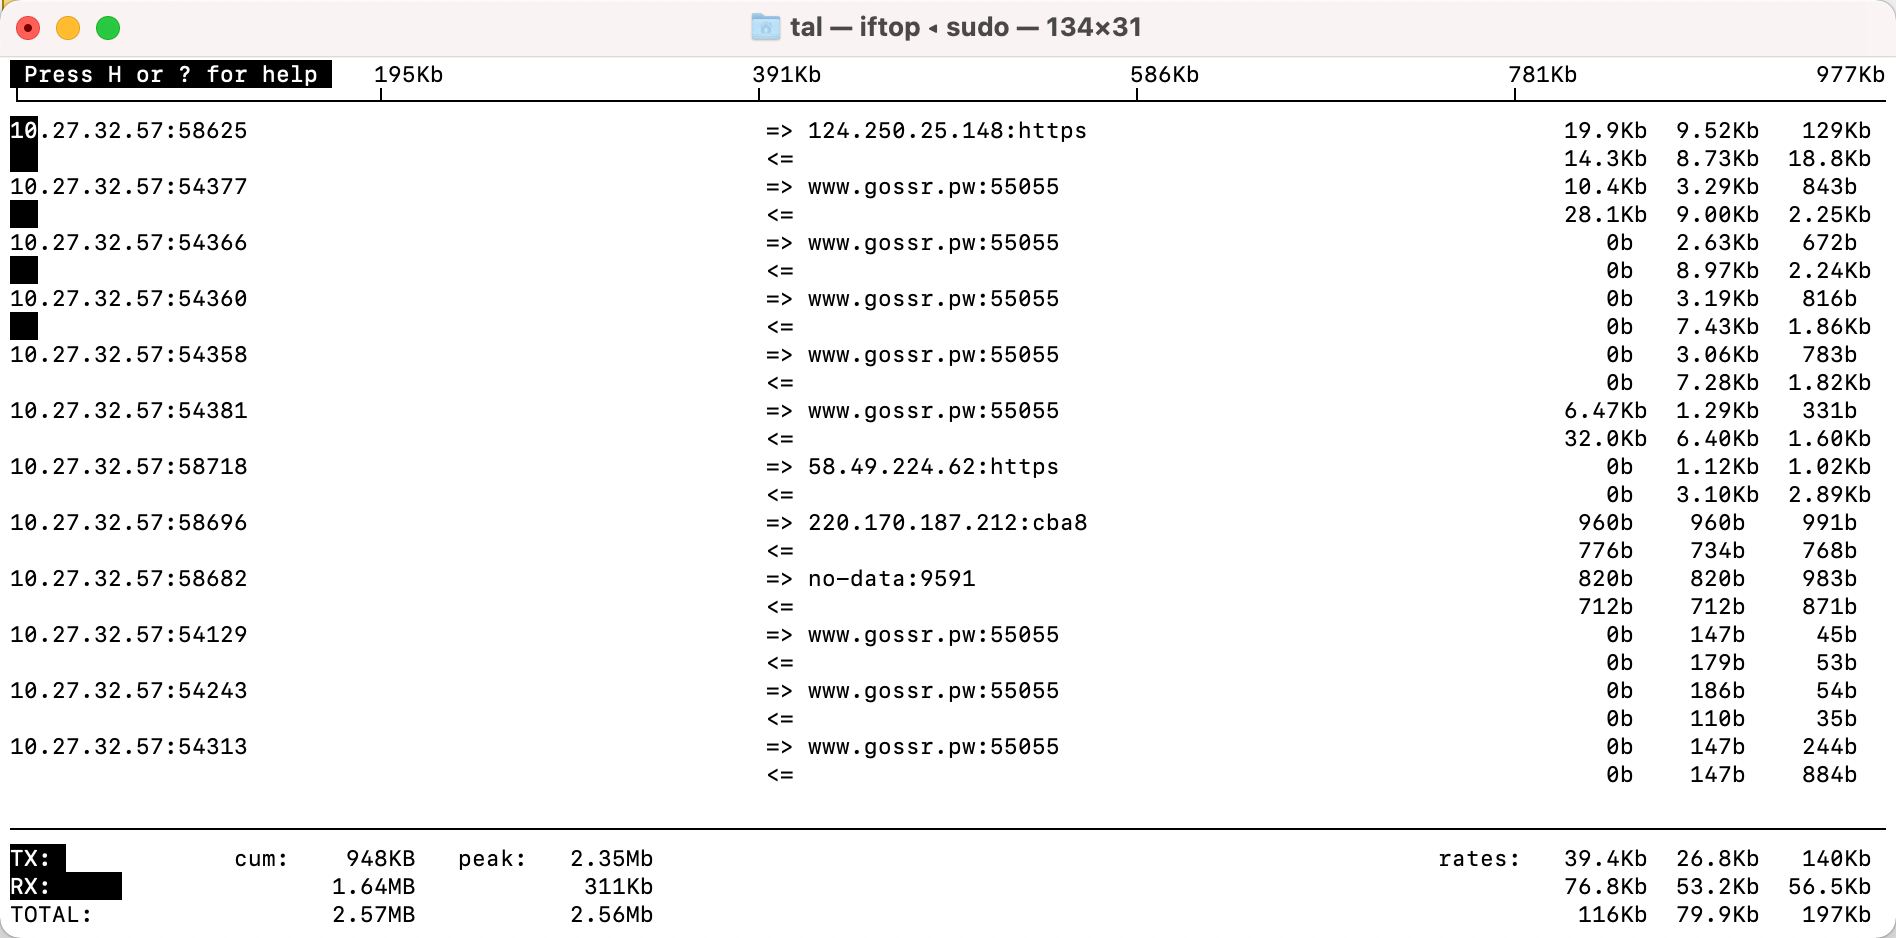
然后能发现流量占用大的端口。例如发现 54626 端口不对劲
第二步:分析这个端口被哪个进程占用
直接使用命令分析端口
lsof -i 54626
分析发现进程ID 是 622
第三步:分析进程
直接使用 ps aux 命令来分析,这个命令能看到很多信息:
- USER:该 process 属于哪个用户
- PID :该 process 的进程识别码。
- %CPU:该 process 使用掉的 CPU 资源百分比;
- %MEM:该 process 所占用的实体内存百分比;
- VSZ :该 process 使用掉的虚拟内存量 (Kbytes)
- RSS :该 process 占用的固定的内存量 (Kbytes)
- TTY :该 process 是在那個终端上面运作
- STAT:该进程目前的状态 (D/R/S/T/Z)
- D 不可中断 uninterruptible sleep (usually IO)
- R 运行 runnable (on run queue)
- S 中断 sleeping
- T 停止 traced or stopped
- Z 僵死 a defunct (”zombie”) process
- 其它状态还包括W(无驻留页), <(高优先级进程), N(低优先级进程), L(内存锁页).
- START:该 process 被触发启动的时间;
- TIME :该 process 实际使用 CPU 运行的时间。
- COMMAND:该程序的实际指令
ps aux | grep 622
根据结果来分析什么程序引起的流量异常,之后是 kill 进程或者卸载对应软件,根据需求来就搞定了。
最后恰饭 阿里云全系列产品/短信包特惠购买 中小企业上云最佳选择 阿里云内部优惠券
Recommend
About Joyk
Aggregate valuable and interesting links.
Joyk means Joy of geeK