

OWASP Top 10
source link: https://owasp.org/Top10/
Go to the source link to view the article. You can view the picture content, updated content and better typesetting reading experience. If the link is broken, please click the button below to view the snapshot at that time.

Introduction to OWASP Top 10 2021
Welcome to the latest installment of the OWASP Top 10! The OWASP Top 10 2021 is all-new, with a new graphic design and an available one-page infographic you can print or obtain from our home page.
A huge thank you to everyone that contributed their time and data for this iteration. Without you, this installment would not happen. THANK YOU.
What's changed in the Top 10 for 2021
There are three new categories, four categories with naming and scoping changes, and some consolidation in the Top 10 for 2021.
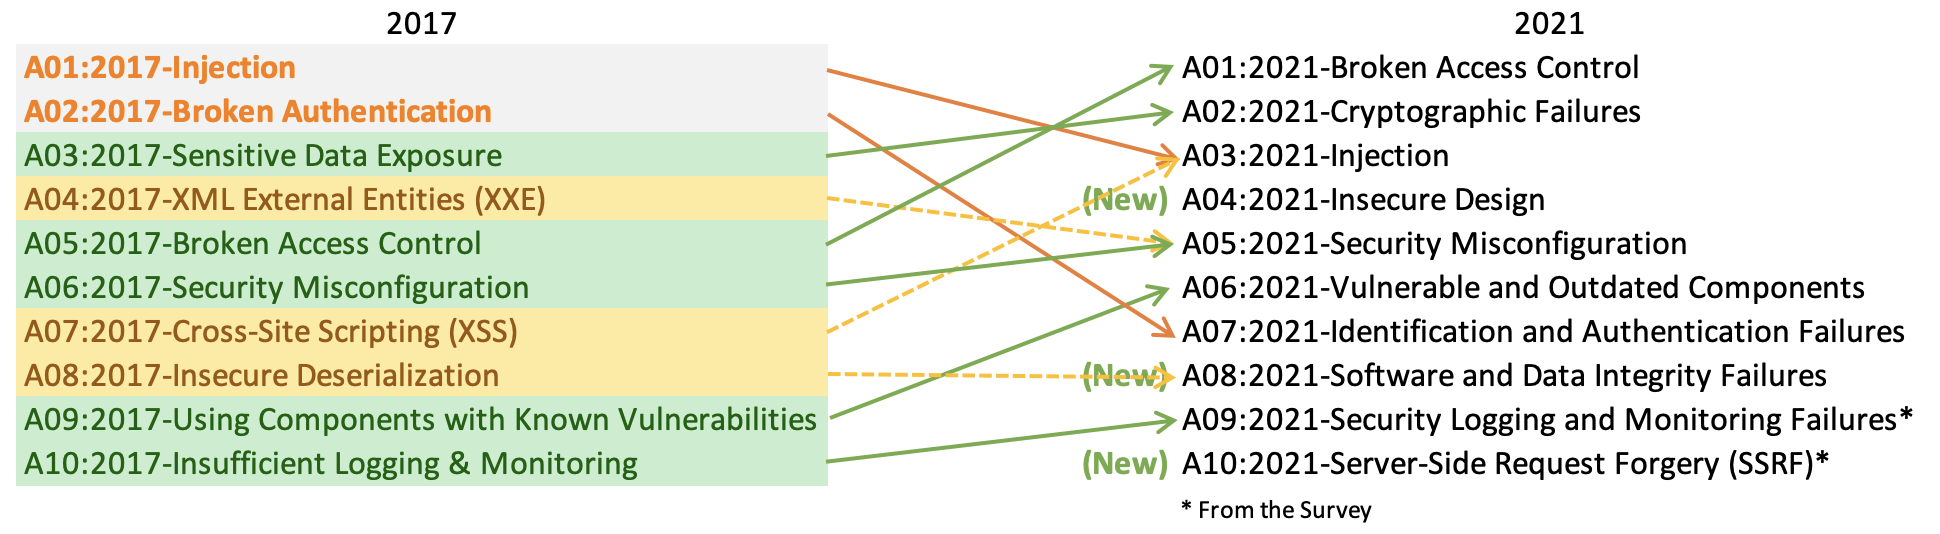
A01:2021-Broken Access Control moves up from the fifth position; 94% of applications were tested for some form of broken access control. The 34 CWEs mapped to Broken Access Control had more occurrences in applications than any other category.
A02:2021-Cryptographic Failures shifts up one position to #2, previously known as Sensitive Data Exposure, which was broad symptom rather than a root cause. The renewed focus here is on failures related to cryptography which often leads to sensitive data exposure or system compromise.
A03:2021-Injection slides down to the third position. 94% of the applications were tested for some form of injection, and the 33 CWEs mapped into this category have the second most occurrences in applications. Cross-site Scripting is now part of this category in this edition.
A04:2021-Insecure Design is a new category for 2021, with a focus on risks related to design flaws. If we genuinely want to "move left" as an industry, it calls for more use of threat modeling, secure design patterns and principles, and reference architectures.
A05:2021-Security Misconfiguration moves up from #6 in the previous edition; 90% of applications were tested for some form of misconfiguration. With more shifts into highly configurable software, it's not surprising to see this category move up. The former category for XML External Entities (XXE) is now part of this category.
A06:2021-Vulnerable and Outdated Components was previously titled Using Components with Known Vulnerabilities and is #2 in the industry survey, but also had enough data to make the Top 10 via data analysis. This category moves up from #9 in 2017 and is a known issue that we struggle to test and assess risk. It is the only category not to have any CVEs mapped to the included CWEs, so a default exploit and impact weights of 5.0 are factored into their scores.
A07:2021-Identification and Authentication Failures was previously Broken Authentication and is sliding down from the second position, and now includes CWEs that are more related to identification failures. This category is still an integral part of the Top 10, but the increased availability of standardized frameworks seems to be helping.
A08:2021-Software and Data Integrity Failures is a new category for 2021, focusing on making assumptions related to software updates, critical data, and CI/CD pipelines without verifying integrity. One of the highest weighted impacts from CVE/CVSS data mapped to the 10 CWEs in this category. Insecure Deserialization from 2017 is now a part of this larger category.
A09:2021-Security Logging and Monitoring Failures was previously Insufficient Logging & Monitoring and is added from the industry survey (#3), moving up from #10 previously. This category is expanded to include more types of failures, is challenging to test for, and isn't well represented in the CVE/CVSS data. However, failures in this category can directly impact visibility, incident alerting, and forensics.
A10:2021-Server-Side Request Forgery is added from the industry survey (#1). The data shows a relatively low incidence rate with above average testing coverage, along with above-average ratings for Exploit and Impact potential. This category represents the scenario where the industry professionals are telling us this is important, even though it's not illustrated in the data at this time.
Methodology
This installment of the Top 10 is more data-driven than ever but not blindly data-driven. We selected eight of the ten categories from contributed data and two categories from an industry survey at a high level. We do this for a fundamental reason, looking at the contributed data is looking into the past. AppSec researchers take time to find new vulnerabilities and new ways to test for them. It takes time to integrate these tests into tools and processes. By the time we can reliably test a weakness at scale, years have likely passed. To balance that view, we use an industry survey to ask people on the front lines what they see as essential weaknesses that the data may not show yet.
There are a few critical changes that we adopted to continue to mature the Top 10.
How the categories are structured
A few categories have changed from the previous installment of the OWASP Top Ten. Here is a high-level summary of the category changes.
Previous data collection efforts were focused on a prescribed subset of approximately 30 CWEs with a field asking for additional findings. We learned that organizations would primarily focus on just those 30 CWEs and rarely add additional CWEs that they saw. In this iteration, we opened it up and just asked for data, with no restriction on CWEs. We asked for the number of applications tested for a given year (starting in 2017), and the number of applications with at least one instance of a CWE found in testing. This format allows us to track how prevalent each CWE is within the population of applications. We ignore frequency for our purposes; while it may be necessary for other situations, it only hides the actual prevalence in the application population. Whether an application has four instances of a CWE or 4,000 instances is not part of the calculation for the Top 10. We went from approximately 30 CWEs to almost 400 CWEs to analyze in the dataset. We plan to do additional data analysis as a supplement in the future. This significant increase in the number of CWEs necessitates changes to how the categories are structured.
We spent several months grouping and categorizing CWEs and could have continued for additional months. We had to stop at some point. There are both root cause and symptom types of CWEs, where root cause types are like "Cryptographic Failure" and "Misconfiguration" contrasted to symptom types like "Sensitive Data Exposure" and "Denial of Service." We decided to focus on the root cause whenever possible as it's more logical for providing identification and remediation guidance. Focusing on the root cause over the symptom isn't a new concept; the Top Ten has been a mix of symptom and root cause. CWEs are also a mix of symptom and root cause; we are simply being more deliberate about it and calling it out. There is an average of 19.6 CWEs per category in this installment, with the lower bounds at 1 CWE for A10:2021-Server-Side Request Forgery (SSRF) to 40 CWEs in A04:2021-Insecure Design. This updated category structure offers additional training benefits as companies can focus on CWEs that make sense for a language/framework.
How the data is used for selecting categories
In 2017, we selected categories by incidence rate to determine likelihood, then ranked them by team discussion based on decades of experience for Exploitability, Detectability (also likelihood), and Technical Impact. For 2021, we want to use data for Exploitability and Impact if possible.
We downloaded OWASP Dependency Check and extracted the CVSS Exploit, and Impact scores grouped by related CWEs. It took a fair bit of research and effort as all the CVEs have CVSSv2 scores, but there are flaws in CVSSv2 that CVSSv3 should address. After a certain point in time, all CVEs are assigned a CVSSv3 score as well. Additionally, the scoring ranges and formulas were updated between CVSSv2 and CVSSv3.
In CVSSv2, both Exploit and Impact could be up to 10.0, but the formula would knock them down to 60% for Exploit and 40% for Impact. In CVSSv3, the theoretical max was limited to 6.0 for Exploit and 4.0 for Impact. With the weighting considered, the Impact scoring shifted higher, almost a point and a half on average in CVSSv3, and exploitability moved nearly half a point lower on average.
There are 125k records of a CVE mapped to a CWE in the NVD data extracted from OWASP Dependency Check, and there are 241 unique CWEs mapped to a CVE. 62k CWE maps have a CVSSv3 score, which is approximately half of the population in the data set.
For the Top Ten, we calculated average exploit and impact scores in the following manner. We grouped all the CVEs with CVSS scores by CWE and weighted both exploit and impact scored by the percentage of the population that had CVSSv3 + the remaining population of CVSSv2 scores to get an overall average. We mapped these averages to the CWEs in the dataset to use as Exploit and Impact scoring for the other half of the risk equation.
Why not just pure statistical data?
The results in the data are primarily limited to what we can test for in an automated fashion. Talk to a seasoned AppSec professional, and they will tell you about stuff they find and trends they see that aren't yet in the data. It takes time for people to develop testing methodologies for certain vulnerability types and then more time for those tests to be automated and run against a large population of applications. Everything we find is looking back in the past and might be missing trends from the last year, which are not present in the data.
Therefore, we only pick eight of ten categories from the data because it's incomplete. The other two categories are from the industry survey. It allows the practitioners on the front lines to vote for what they see as the highest risks that might not be in the data (and may never be expressed in data).
Why incidence rate instead of frequency?
There are three primary sources of data. We identify them as Human-assisted Tooling (HaT), Tool-assisted Human (TaH), and raw Tooling.
Tooling and HaT are high-frequency finding generators. Tools will look for specific vulnerabilities and tirelessly attempt to find every instance of that vulnerability and will generate high finding counts for some vulnerability types. Look at Cross-Site Scripting, which is typically one of two flavors: it's either a more minor, isolated mistake or a systemic issue. When it's a systemic issue, the finding counts can be in the thousands for an application. This high frequency drowns out most other vulnerabilities found in reports or data.
TaH, on the other hand, will find a broader range of vulnerability types but at a much lower frequency due to time constraints. When humans test an application and see something like Cross-Site Scripting, they will typically find three or four instances and stop. They can determine a systemic finding and write it up with a recommendation to fix on an application-wide scale. There is no need (or time) to find every instance.
Suppose we take these two distinct data sets and try to merge them on frequency. In that case, the Tooling and HaT data will drown the more accurate (but broad) TaH data and is a good part of why something like Cross-Site Scripting has been so highly ranked in many lists when the impact is generally low to moderate. It's because of the sheer volume of findings. (Cross-Site Scripting is also reasonably easy to test for, so there are many more tests for it as well).
In 2017, we introduced using incidence rate instead to take a fresh look at the data and cleanly merge Tooling and HaT data with TaH data. The incidence rate asks what percentage of the application population had at least one instance of a vulnerability type. We don't care if it was one-off or systemic. That's irrelevant for our purposes; we just need to know how many applications had at least one instance, which helps provide a clearer view of the testing is findings across multiple testing types without drowning the data in high-frequency results.
What is your data collection and analysis process?
We formalized the OWASP Top 10 data collection process at the Open Security Summit in 2017. OWASP Top 10 leaders and the community spent two days working out formalizing a transparent data collection process. The 2021 edition is the second time we have used this methodology.
We publish a call for data through social media channels available to us, both project and OWASP. On the OWASP Project page, we list the data elements and structure we are looking for and how to submit them. In the GitHub project, we have example files that serve as templates. We work with organizations as needed to help figure out the structure and mapping to CWEs.
We get data from organizations that are testing vendors by trade, bug bounty vendors, and organizations that contribute internal testing data. Once we have the data, we load it together and run a fundamental analysis of what CWEs map to risk categories. There is overlap between some CWEs, and others are very closely related (ex. Cryptographic vulnerabilities). Any decisions related to the raw data submitted are documented and published to be open and transparent with how we normalized the data.
We look at the eight categories with the highest incidence rates for inclusion in the Top 10. We also look at the industry survey results to see which ones may already be present in the data. The top two votes that aren't already present in the data will be selected for the other two places in the Top 10. Once all ten were selected, we applied generalized factors for exploitability and impact; to help rank the Top 10 in order.
Data Factors
There are data factors that are listed for each of the Top 10 Categories, here is what they mean:
-
CWEs Mapped: The number of CWEs mapped to a category by the Top 10 team.
-
Incidence Rate: Incidence rate is the percentage of applications vulnerable to that CWE from the population tested by that org for that year.
-
(Testing) Coverage: The percentage of applications tested by all organizations for a given CWE.
-
Weighted Exploit: The Exploit sub-score from CVSSv2 and CVSSv3 scores assigned to CVEs mapped to CWEs, normalized, and placed on a 10pt scale.
-
Weighted Impact: The Impact sub-score from CVSSv2 and CVSSv3 scores assigned to CVEs mapped to CWEs, normalized, and placed on a 10pt scale.
-
Total Occurrences: Total number of applications found to have the CWEs mapped to a category.
-
Total CVEs: Total number of CVEs in the NVD DB that were mapped to the CWEs mapped to a category.
Category Relationships from 2017
There has been a lot of talk about the overlap between the Top Ten risks. By the definition of each (list of CWEs included), there really isn't any overlap. However, conceptually, there can be overlap or interactions based on the higher-level naming. Venn diagrams are many times used to show overlap like this.
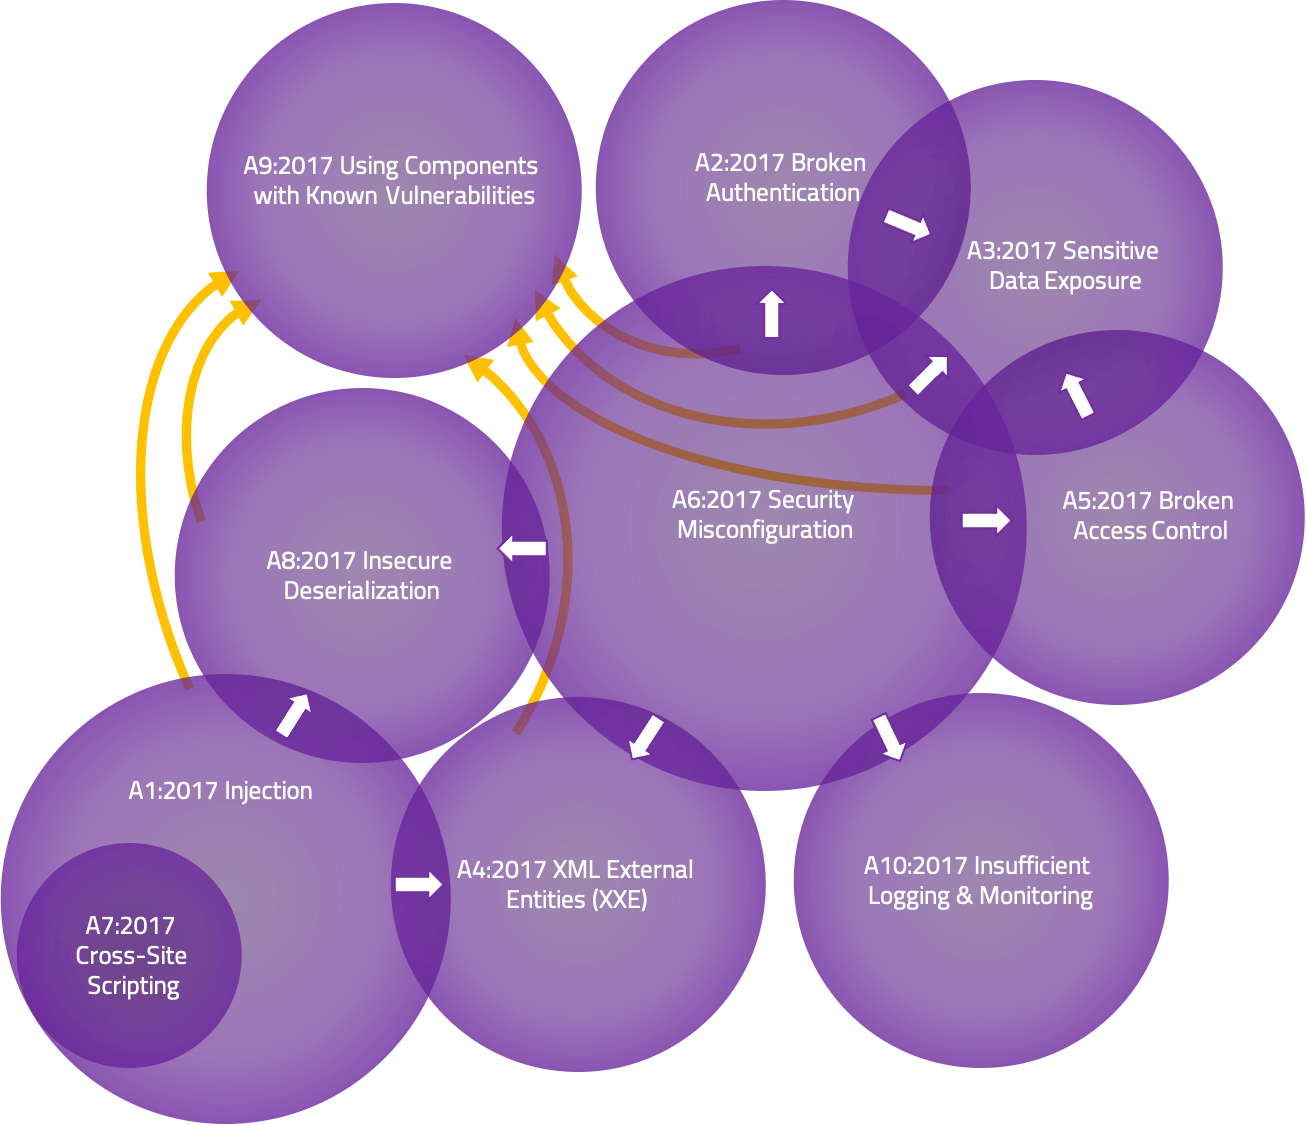
The Venn diagram above represents the interactions between the Top Ten 2017 risk categories. While doing so, a couple of essential points became obvious:
-
One could argue that Cross-Site Scripting ultimately belongs within Injection as it's essentially Content Injection. Looking at the 2021 data, it became even more evident that XSS needed to move into Injection.
-
The overlap is only in one direction. We will often classify a vulnerability by the end manifestation or "symptom," not the (potentially deep) root cause. For instance, "Sensitive Data Exposure" may have been the result of a "Security Misconfiguration"; however, you won't see it in the other direction. As a result, arrows are drawn in the interaction zones to indicate which direction it occurs.
-
Sometimes these diagrams are drawn with everything in A06:2021 Using Components with Known Vulnerabilities. While some of these risk categories may be the root cause of third-party vulnerabilities, they are generally managed differently and with different responsibilities. The other types are typically representing first-party risks.
Thank you to our data contributors
The following organizations (along with some anonymous donors) kindly donated data for over 500,000 applications to make this the largest and most comprehensive application security data set. Without you, this would not be possible.
Recommend
About Joyk
Aggregate valuable and interesting links.
Joyk means Joy of geeK