

Making Reasonable Use of Computer Resources: Part 2
source link: https://vfoley.xyz/reasonable-use-2/
Go to the source link to view the article. You can view the picture content, updated content and better typesetting reading experience. If the link is broken, please click the button below to view the snapshot at that time.
Making Reasonable Use of Computer Resources: Part 2
28 Aug 2021In my last post I made the case that programmers should try and write their software in a way that makes reasonable use of the resources of the computer. By reasonable use, I didn’t mean to try and perform every crazy micro-optimization possible to extract every last speck of performance from the machine: instead, I meant to have mechanical sympathy and to write software in a way that works with the hardware rather than against it.
That article had an example of how being mindful of the CPU cache can make one algorithm nearly 16 times faster than another, even though they have the same complexity. I’ve been wanting to find a more real-world example and this week one just feel in my lap.
A year ago, Mark Litwintschik wrote an article where he extracted the domain name from a 12 GiB gzip file containing 1.27 billion lines of JSON and created an ip,domain CSV file. That program was written in Python and took more than a day to run!
Last week, he wrote a follow-up article detailing a new program to do the same job, but written in Rust. The new version processed the data in 48 minutes. After he shared his article on lobste.rs, Mark received suggestions to make the program faster and has since brought the processing down to 30 minutes. His new program is 50 times faster than his original — a much better use of the machine’s resources! And yet, when I initially read the article, I thought that 48 minutes sounded slow.
I started working on this before Mark updated his post with the 30 minutes program. But even if I had read the article after he updated it, I would have still thought that 30 minutes sounded kind of slow.
Thankfully, Mark’s article gave links to the dataset and to the third-party library he was using, and he shared his code and the bash commands he ran. It made it easy to replicate his experiment.
Mark’s program works in four phases:
- Read and decompress
- Parse JSON
- Call out to tldextract-rs to extract the domain name
- Write a line of output
The first thing I did was very simple: I timed how long it took to zcat the input. This would help me gauge how long steps 1 and 4 took together. I wanted to know if I was right to think that 48 minutes was slow or if my expectations were wrong.
$ time zcat rdns_xaa.json.gz >/dev/null

real    1m34.420s
user    1m34.047s
sys     0m0.364s
So roughly a minute and a half to decompress, read, and write. I didn’t think that parsing JSON would be much slower than decompressing a gzip file, so most of the time has to be spent in phase 3, extracting the domain name. Since the operation sounds quite simple and straight-forward (find the longest top-level domain suffix, take the substring to the left until a period of the beginning of string is encountered), I suspected that something was probably being wasteful there.
Next, I ran Mark’s original program to know how long it took to run on my machine.
$ perf stat -dd ./target/release/tldextract rdns_xaa.json.gz >/dev/null

 Performance counter stats for './target/release/tldextract rdns_xaa.json.gz':

      1,644,491.19 msec task-clock                #    1.000 CPUs utilized
             8,526      context-switches          #    0.005 K/sec
                72      cpu-migrations            #    0.000 K/sec
             1,103      page-faults               #    0.001 K/sec
 6,678,553,292,544      cycles                    #    4.061 GHz                      (38.46%)
18,119,341,562,549      instructions              #    2.71  insn per cycle           (46.15%)
 3,952,769,540,665      branches                  # 2403.643 M/sec                    (46.15%)
     9,984,392,711      branch-misses             #    0.25% of all branches          (46.15%)
 3,738,006,667,501      L1-dcache-loads           # 2273.048 M/sec                    (46.15%)
    39,713,107,241      L1-dcache-load-misses     #    1.06% of all L1-dcache accesses  (46.15%)
     1,216,763,228      LLC-loads                 #    0.740 M/sec                    (30.77%)
        26,340,299      LLC-load-misses           #    2.16% of all LL-cache accesses  (30.77%)
   <not supported>      L1-icache-loads
   211,529,207,164      L1-icache-load-misses                                         (30.77%)
 3,738,968,599,010      dTLB-loads                # 2273.632 M/sec                    (30.77%)
        18,483,670      dTLB-load-misses          #    0.00% of all dTLB cache accesses  (30.77%)
        38,106,464      iTLB-loads                #    0.023 M/sec                    (30.77%)
       382,508,684      iTLB-load-misses          # 1003.79% of all iTLB cache accesses  (30.77%)

    1644.802173800 seconds time elapsed

    1618.366720000 seconds user
      26.137782000 seconds sys
I like to use `perf stat -dd` instead of `time`; it gives a more complete picture
So 27 minutes (instead of 48 like Mark) on my machine. While the program was running, I also ran perf top to look at which functions were taking the most time.
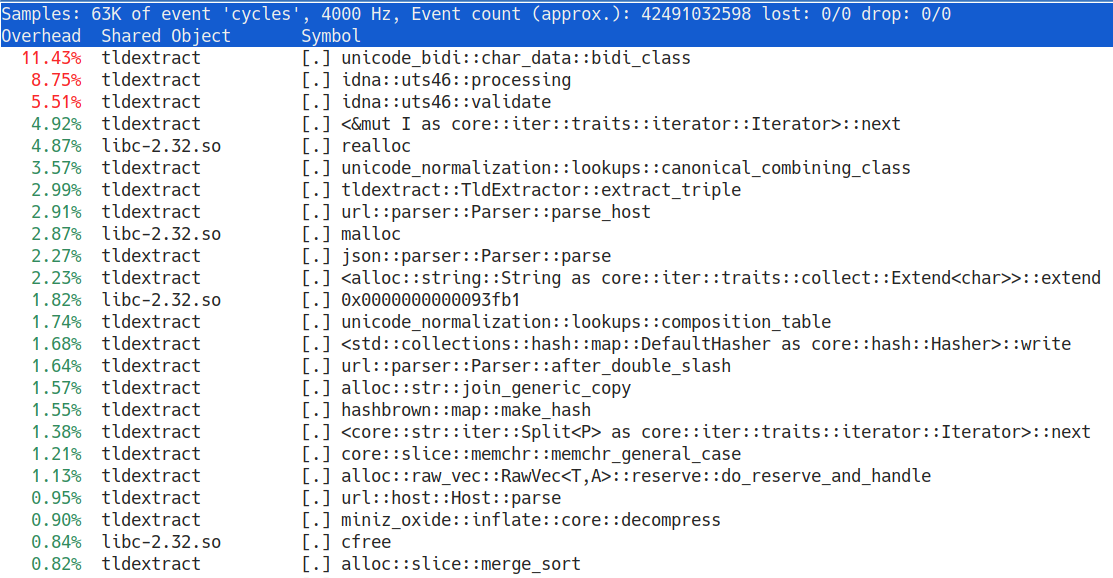
When I skimmed the original program and the third-party library, I thought that they allocated a lot. For example, the .lines() iterator allocates a new string for every line of input and when the line goes out of scope, it’ll be freed. That’s 1.27 billion pairs of allocation and deallocation. With malloc/realloc/free taking nearly 10% of the total execution time, it seems that’s a problem.
But the real big problem is in the third-party library to manipulate domains. Since domains are allowed to have Unicode in them, a lot of time is spent in IDNA code. But is that really necessary? Does the data that we manipulate require that we impose the extra cost of Unicode domain names upon us?
What I found by looking at the data is that all the JSON objects contain only ASCII characters and only 20 objects out of 1.27 billion contain the substrings \u or \U (JSON unicode escape sequences). That means that the original program is using a library that makes processing the whole batch a lot slower for the benefit of only 0.00000157% of the entries. Instead of solving the generic case, let’s solve the common case.
$ parallel "zcat {} | grep -P '[^\000-\177]' | wc -l" ::: rdns_xa*.gz
0
0
0
0

$ parallel "zcat {} | grep -iF '\u' | wc -l" ::: rdns_xa*.gz
14
1
5
0
Bash commands to search for Unicode in the data
So given what we know, here’s the plan for a (hopefully) faster program. Like the original program we’ll use flate2’s GzDecoder to decompress the data. We are not going to use the lines iterator, instead we’re going to use BufReader.read_line() which allows us to re-use the same buffer. When we have a line, we’re going to search for the substring \u; if it’s found, we write that line to a file called rejected.json that we can process separately and move on to the next line. We’re going to use serde_json instead of json, because it’s faster. To find the top-level domain, we’ll have a HashSet of all the domain suffixes (obtained from here) and we’ll find the longest suffix we can; once we have it, we can extract the string to its left. Finally, we write out to stdout, but not with println!, but with a pre-locked Stdout object.
$ perf stat -dd ./target/release/vfb-tldextract public_suffix_list.dat rdns_xaa.json.gz rejected_xaa.json >/dev/null
vfb-tldextract: cannot deserialize this line: "{\"timestamp\":\"1627471863\",\"name\":\"152.149.215.39\",\"type\":\"ptr\"}\n"
vfb-tldextract: cannot deserialize this line: "{\"timestamp\":\"1627447667\",\"name\":\"152.149.215.40\",\"type\":\"ptr\"}\n"
vfb-tldextract: cannot deserialize this line: "{\"timestamp\":\"1627444989\",\"name\":\"152.149.215.43\",\"type\":\"ptr\"}\n"
vfb-tldextract: cannot deserialize this line: "{\"timestamp\":\"1627486727\",\"name\":\"152.149.215.45\",\"type\":\"ptr\"}\n"
vfb-tldextract: processed 310673926 lines (14 rejected) in 155.272128427s

 Performance counter stats for './target/release/vfb-tldextract ../tldextract/public_suffix_list.dat ../tldextract/rdns_xaa.json.gz rejected_xaa.json':

        155,270.78 msec task-clock                #    1.000 CPUs utilized
               451      context-switches          #    0.003 K/sec
                 1      cpu-migrations            #    0.000 K/sec
               345      page-faults               #    0.002 K/sec
   631,384,933,925      cycles                    #    4.066 GHz                      (38.46%)
 1,803,019,603,887      instructions              #    2.86  insn per cycle           (46.15%)
   365,196,577,639      branches                  # 2351.998 M/sec                    (46.15%)
     2,314,559,123      branch-misses             #    0.63% of all branches          (46.15%)
   379,148,826,483      L1-dcache-loads           # 2441.856 M/sec                    (46.15%)
     2,166,436,251      L1-dcache-load-misses     #    0.57% of all L1-dcache accesses  (46.15%)
        75,583,470      LLC-loads                 #    0.487 M/sec                    (30.77%)
        25,064,718      LLC-load-misses           #   33.16% of all LL-cache accesses  (30.77%)
   <not supported>      L1-icache-loads
       300,858,674      L1-icache-load-misses                                         (30.77%)
   379,351,678,372      dTLB-loads                # 2443.162 M/sec                    (30.77%)
           105,344      dTLB-load-misses          #    0.00% of all dTLB cache accesses  (30.77%)
           506,821      iTLB-loads                #    0.003 M/sec                    (30.77%)
         2,868,354      iTLB-load-misses          #  565.95% of all iTLB cache accesses  (30.77%)

     155.275422832 seconds time elapsed

     154.847572000 seconds user
       0.423987000 seconds sys
2 minutes and 35 seconds; 10 times faster than the original program and less that twice the time to just `zcat`.
Now the final test, how long does it take to transform the four shards in parallel?
$ time /usr/bin/ls rdns*.json.gz | xargs -P4 -n1 -I{} sh -c './vfb-tldextract public_suffix_list.dat {} {}.rejected.json >{}.csv'
vfb-tldextract: cannot deserialize this line: "{\"timestamp\":\"1627442231\",\"name\":\"41.185.37.10\",\"type\":\"ptr\"}\n"
vfb-tldextract: cannot deserialize this line: "{\"timestamp\":\"1627473254\",\"name\":\"41.185.37.11\",\"type\":\"ptr\"}\n"
vfb-tldextract: cannot deserialize this line: "{\"timestamp\":\"1627458666\",\"name\":\"41.185.37.12\",\"type\":\"ptr\"}\n"
vfb-tldextract: cannot deserialize this line: "{\"timestamp\":\"1627479199\",\"name\":\"41.185.37.13\",\"type\":\"ptr\"}\n"
vfb-tldextract: cannot deserialize this line: "{\"timestamp\":\"1627439294\",\"name\":\"41.185.37.14\",\"type\":\"ptr\"}\n"
vfb-tldextract: cannot deserialize this line: "{\"timestamp\":\"1627471863\",\"name\":\"152.149.215.39\",\"type\":\"ptr\"}\n"
vfb-tldextract: cannot deserialize this line: "{\"timestamp\":\"1627447667\",\"name\":\"152.149.215.40\",\"type\":\"ptr\"}\n"
vfb-tldextract: cannot deserialize this line: "{\"timestamp\":\"1627444989\",\"name\":\"152.149.215.43\",\"type\":\"ptr\"}\n"
vfb-tldextract: cannot deserialize this line: "{\"timestamp\":\"1627486727\",\"name\":\"152.149.215.45\",\"type\":\"ptr\"}\n"
vfb-tldextract: cannot deserialize this line: "{\"timestamp\":\"1627490888\",\"name\":\"210.35.32.3\",\"type\":\"ptr\"}\n"
vfb-tldextract: processed 310673940 lines (0 rejected) in 184.360843703s
vfb-tldextract: processed 310673926 lines (14 rejected) in 184.376276827s
vfb-tldextract: processed 310673939 lines (1 rejected) in 184.705608281s
vfb-tldextract: processed 310673935 lines (5 rejected) in 188.207680141s

real    3m8.222s
user    11m53.263s
sys     0m16.673s
It’s slower than just one shard at a time (I haven’t yet investigated why that is; my guess is that we’re maxing out the write speed of the disk) but still nearly 10x faster than the original program. And I think we did things that most programmers would be able to do:
- Get a base line for how fast we can
zcata file - Use
perf topto find some bottlenecks that can be addressed - Look at the data to understand what the common case is
And I think that the final program is something that most people reading this would probably have been able to do themselves.
If you’d like to look at my code, it’s available on Github.
Recommend
About Joyk
Aggregate valuable and interesting links.
Joyk means Joy of geeK