

K-means and decision tree using Weka and JavaFX
source link: http://fxapps.blogspot.com/2017/06/k-means-and-decision-tree-using-weka.html
Go to the source link to view the article. You can view the picture content, updated content and better typesetting reading experience. If the link is broken, please click the button below to view the snapshot at that time.

K-means and decision tree using Weka and JavaFX
Weka is one of the most known tools for Machine Learning in Java, which also has a great Java API including API for k-means clustering. Using JavaFX it is possible to visualize unclassified data, classify the data using Weka APIs and then visualize the result in a JavaFX chart, like the Scatter chart.
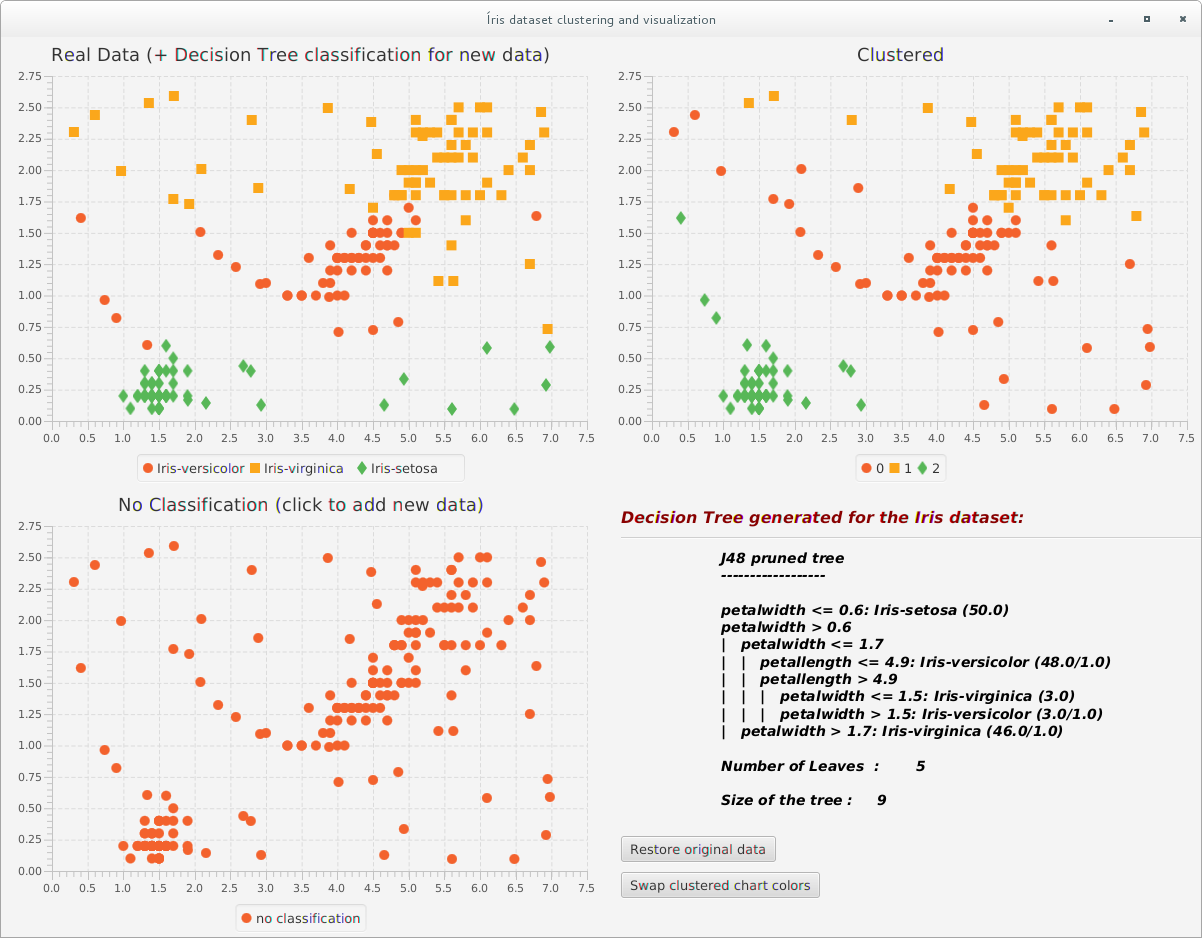
In this post we will show a simple application that allows you to load data, show it without series distinction using a JavaFX scatter chart,, then we use Weka to classify the data in a defined number of clusters and finally separated the clustered data by chart series. We will be using the Iris.2D.arff file that comes with Weka download.
K-means clustering using Weka is really simple and requires only a few lines of code as you can see in this post. In our application we will build 3 charts for the Iris dataset:
- Data without class distinction (no classes)
- The data with the ground truth classification
- Data clustered using weka

private List<Series<Number, Number>> buildClusteredSeries(Instances data) throws Exception { List<XYChart.Series<Number, Number>> clusteredSeries = new ArrayList<>(); // to buld the cluster we remove the class information Remove remove = new Remove(); remove.setAttributeIndices("3"); remove.setInputFormat(data); Instances dataToBeClustered = Filter.useFilter(data, remove);
SimpleKMeans kmeans = new SimpleKMeans(); kmeans.setSeed(10); kmeans.setPreserveInstancesOrder(true); kmeans.setNumClusters(3); kmeans.buildClusterer(dataToBeClustered); data.deleteStringAttributes();
int[] assignments = kmeans.getAssignments(); for (int c = 0; c < 3; c++) { XYChart.Series<Number, Number> series = new XYChart.Series<>(); series.setName("Cluster " + c); clusteredSeries.add(series); } for (int i = 0; i < assignments.length; i++) { int clusterNum = assignments[i]; clusteredSeries.get(clusterNum).getData().add(instancetoChartData(data.get(i))); } return clusteredSeries; }

datafile = new BufferedReader(new FileReader(DATA_SET)); data = new Instances(datafile); data.setClassIndex(data.numAttributes() - 1); tree = new J48(); tree.buildClassifier(data); Instance instance = new DenseInstance(3); instance.setDataset(data); instance.setValue(0, xValue.doubleValue()); instance.setValue(1, yValue.doubleValue()); double predictedClass = tree.classifyInstance(instance); instance.setValue(2, pred
package org.fxapps.ml;
import java.io.BufferedReader; import java.io.FileReader; import java.util.ArrayList; import java.util.Arrays; import java.util.Collections; import java.util.List; import java.util.stream.Collectors; import java.util.stream.IntStream;
import javafx.application.Application; import javafx.geometry.Point2D; import javafx.scene.Scene; import javafx.scene.chart.Axis; import javafx.scene.chart.NumberAxis; import javafx.scene.chart.ScatterChart; import javafx.scene.chart.XYChart; import javafx.scene.chart.XYChart.Data; import javafx.scene.chart.XYChart.Series; import javafx.scene.control.Button; import javafx.scene.control.Label; import javafx.scene.control.Separator; import javafx.scene.layout.GridPane; import javafx.scene.layout.VBox; import javafx.scene.paint.Color; import javafx.scene.text.Font; import javafx.scene.text.FontPosture; import javafx.scene.text.FontWeight; import javafx.scene.text.Text; import javafx.scene.text.TextAlignment; import javafx.stage.Stage; import weka.classifiers.trees.J48; import weka.clusterers.SimpleKMeans; import weka.core.Attribute; import weka.core.DenseInstance; import weka.core.Instance; import weka.core.Instances; import weka.filters.Filter; import weka.filters.unsupervised.attribute.Remove;
public class Clustering extends Application {
private static final int NUMBER_OF_CLASSES = 3;
private static final String DATA_SET = "/opt/weka/weka-3-7-12/data/iris.2D.arff";
private ScatterChart<Number, Number> clusteredChart; private ScatterChart<Number, Number> realDataChart; private ScatterChart<Number, Number> noClassificationChart;
private static int swapIndex = 0; private int[][] swapColorsCombinations = { { 0, 1 }, { 0, 2 }, { 1, 2 } };
private J48 tree; private Instances data;
public static void main(String[] args) throws Exception { launch(); }
@Override public void start(Stage stage) throws Exception { loadData(); tree = new J48(); tree.buildClassifier(data);
noClassificationChart = buildChart("No Classification (click to add new data)", buildSingleSeries()); clusteredChart = buildChart("Clustered", buildClusteredSeries()); realDataChart = buildChart("Real Data (+ Decision Tree classification for new data)", buildLabeledSeries());
noClassificationChart.setOnMouseClicked(e -> { Axis<Number> xAxis = noClassificationChart.getXAxis(); Axis<Number> yAxis = noClassificationChart.getYAxis(); Point2D mouseSceneCoords = new Point2D(e.getSceneX(), e.getSceneY()); double x = xAxis.sceneToLocal(mouseSceneCoords).getX(); double y = yAxis.sceneToLocal(mouseSceneCoords).getY(); Number xValue = xAxis.getValueForDisplay(x); Number yValue = yAxis.getValueForDisplay(y); reloadSeries(xValue, yValue); });
Label lblDecisionTreeTitle = new Label("Decision Tree generated for the Iris dataset:"); Text txtTree = new Text(tree.toString()); Button btnRestore = new Button("Restore original data"); Button btnSwapColors = new Button("Swap clustered chart colors"); VBox vbDecisionTree = new VBox(10, lblDecisionTreeTitle, new Separator(), txtTree, btnRestore, btnSwapColors);
btnRestore.setOnAction(e -> { loadData(); reloadSeries(); }); btnSwapColors.setOnAction(e -> swapClusteredChartSeriesColors()); lblDecisionTreeTitle.setTextFill(Color.DARKRED); lblDecisionTreeTitle.setFont(Font.font(Font.getDefault().getFamily(), FontWeight.BOLD, FontPosture.ITALIC, 16)); txtTree.setTranslateX(100); txtTree.setFont(Font.font(Font.getDefault().getFamily(), FontWeight.BOLD, FontPosture.ITALIC, 14)); txtTree.setLineSpacing(1); txtTree.setTextAlignment(TextAlignment.LEFT); vbDecisionTree.setTranslateY(20); vbDecisionTree.setTranslateX(20);
GridPane gpRoot = new GridPane(); gpRoot.add(realDataChart, 0, 0); gpRoot.add(clusteredChart, 1, 0); gpRoot.add(noClassificationChart, 0, 1); gpRoot.add(vbDecisionTree, 1, 1);
stage.setScene(new Scene(gpRoot)); stage.setTitle("Íris dataset clustering and visualization"); stage.show(); }
private void loadData() { BufferedReader datafile; try { datafile = new BufferedReader(new FileReader(DATA_SET)); data = new Instances(datafile); data.setClassIndex(data.numAttributes() - 1); } catch (Exception e) { System.out.println("Exception loading data... Leaving"); e.printStackTrace(); System.exit(0); } }
private void reloadSeries(Number xValue, Number yValue) { try { Instance instance = new DenseInstance(NUMBER_OF_CLASSES); instance.setDataset(data); instance.setValue(0, xValue.doubleValue()); instance.setValue(1, yValue.doubleValue()); double predictedClass = tree.classifyInstance(instance); instance.setValue(2, predictedClass); data.add(instance); reloadSeries(); } catch (Exception e) { e.printStackTrace(); } }
private void reloadSeries() { try { noClassificationChart.getData().clear(); clusteredChart.getData().clear(); realDataChart.getData().clear(); noClassificationChart.getData().addAll(buildSingleSeries()); clusteredChart.getData().addAll(buildClusteredSeries()); realDataChart.getData().addAll(buildLabeledSeries()); } catch (Exception e) { e.printStackTrace(); } } private void swapClusteredChartSeriesColors() { List<Series<Number, Number>> clusteredSeries = new ArrayList<>(); // we have to copy the original data to swap the series clusteredChart.getData().forEach(serie -> { Series<Number, Number> series = new Series<>(); serie.getData().stream().map(d -> new Data<Number, Number>(d.getXValue(), d.getYValue())) .forEach(series.getData()::add); clusteredSeries.add(series); }); int i = swapColorsCombinations[swapIndex][0]; int j = swapColorsCombinations[swapIndex][1]; Collections.swap(clusteredSeries, i, j); clusteredChart.getData().clear(); clusteredChart.getData().addAll(clusteredSeries); swapIndex = swapIndex == NUMBER_OF_CLASSES - 1 ? 0 : swapIndex + 1; }
private List<XYChart.Series<Number, Number>> buildSingleSeries() { XYChart.Series<Number, Number> singleSeries = new XYChart.Series<>(); data.stream().map(this::instancetoChartData).forEach(singleSeries.getData()::add); singleSeries.setName("no classification"); return Arrays.asList(singleSeries); }
private List<Series<Number, Number>> buildLabeledSeries() { List<XYChart.Series<Number, Number>> realSeries = new ArrayList<>(); Attribute irisClasses = data.attribute(2); data.stream().collect(Collectors.groupingBy(d -> { int i = (int) d.value(2); return irisClasses.value(i); })).forEach((e, instances) -> { XYChart.Series<Number, Number> series = new XYChart.Series<>(); series.setName(e); instances.stream().map(this::instancetoChartData).forEach(series.getData()::add); realSeries.add(series); }); return realSeries; }
private List<Series<Number, Number>> buildClusteredSeries() throws Exception { List<XYChart.Series<Number, Number>> clusteredSeries = new ArrayList<>();
// to build the cluster we remove the class information Remove remove = new Remove(); remove.setAttributeIndices("3"); remove.setInputFormat(data); Instances dataToBeClustered = Filter.useFilter(data, remove);
SimpleKMeans kmeans = new SimpleKMeans(); kmeans.setSeed(10); kmeans.setPreserveInstancesOrder(true); kmeans.setNumClusters(3); kmeans.buildClusterer(dataToBeClustered);
IntStream.range(0, 3).mapToObj(i -> { Series<Number, Number> newSeries = new XYChart.Series<>(); newSeries.setName(String.valueOf(i)); return newSeries; }).forEach(clusteredSeries::add);
int[] assignments = kmeans.getAssignments(); for (int i = 0; i < assignments.length; i++) { int clusterNum = assignments[i]; clusteredSeries.get(clusterNum).getData().add(instancetoChartData(data.get(i))); }
return clusteredSeries; }
private XYChart.Data<Number, Number> instancetoChartData(Instance i) { return new XYChart.Data<Number, Number>(i.value(0), i.value(1)); }
private ScatterChart<Number, Number> buildChart(String chartName, List<XYChart.Series<Number, Number>> series) { final NumberAxis xAxis = new NumberAxis(); final NumberAxis yAxis = new NumberAxis(); final ScatterChart<Number, Number> sc = new ScatterChart<Number, Number>(xAxis, yAxis); sc.setTitle(chartName); sc.setPrefHeight(450); sc.setPrefWidth(600); xAxis.getValueForDisplay(1); yAxis.getValueForDisplay(2); sc.getData().addAll(series); return sc; }
}
Recommend
About Joyk
Aggregate valuable and interesting links.
Joyk means Joy of geeK