
.NET Object Allocation Tool Performance
source link: https://devblogs.microsoft.com/visualstudio/net-object-allocation-tool-performance/
Go to the source link to view the article. You can view the picture content, updated content and better typesetting reading experience. If the link is broken, please click the button below to view the snapshot at that time.

.NET Object Allocation Tool Performance

June 30th, 2021
With the release of Visual Studio 16.10 comes a new analysis engine for the Performance Profiler, with the .NET Object Allocation Tool being the first tool to be onboarded. This provides the tool with some new features and a significant perf boost. Give it a shot with your C# app and see what spurious allocations you can remove to speed up your app!
What’s new?
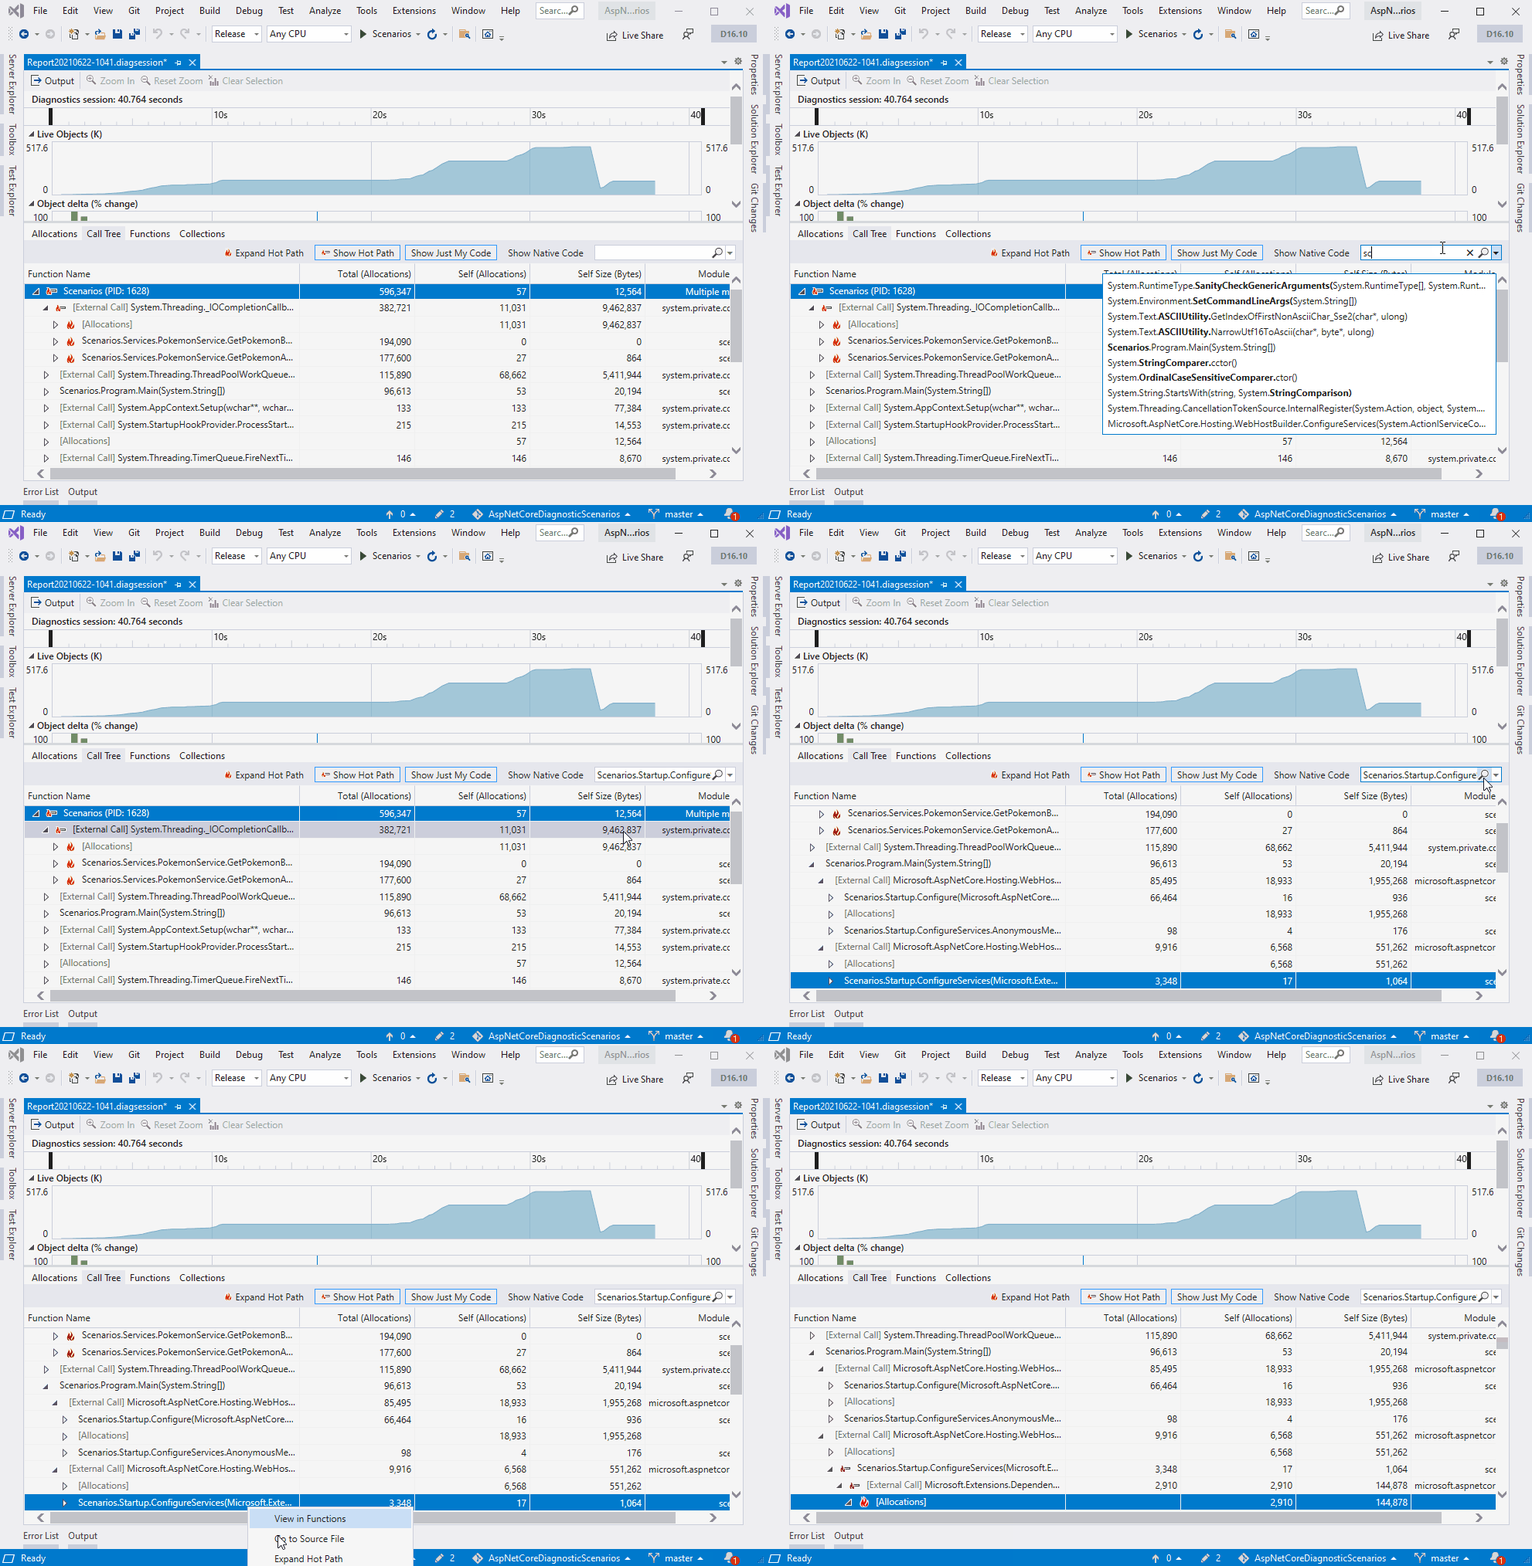
The .NET Object Allocation Tool now has support for Source Link which lets the tool pull down source files when going to source. This lets you see exactly where allocations are happening even if they are not in your code.

Search now has auto complete suggestions to help you find and dig through reports quicker.

Lastly, we have added additional information to the Collections view to try and give more insights into the .NET Garbage Collector (GC). You can now see why a GC occurred along with relevant stats such as how long it took, the heap size, and how many objects were collected.
Let’s see some numbers!
One of the areas we’ve spent the most energy on is improving the performance of .NET Object Allocation Tool. To do that we focused on the two big tasks the tool performs:
- Building the initial allocation model which is used to look up allocations for the views.
- Building the call tree which is used to show the call tree, functions, and backtrace view.
In the table below you can see just have much faster the tool is in the latest version of Visual Studio.
~1.5x faster
295s -> 24s~12x faster
Medium trace (1M allocations) 6.9s -> 3.6s~2x faster
695 -> 58s~11x faster
Large trace (3.1M allocations) 22.5s -> 8.4s~2.5x faster
1556s -> 109s~14x faster
As you can see we are significantly faster, and those numbers aren’t even an apples to apples comparison as the new version does even more analysis but it is still faster than the previous version!
This is just the beginning, the first tool. We are extending these changes to other tools in the Performance Profiler for Visual Studio 2022 and have additional ideas on how we can save even more time. Expect your profiling experience to get a whole lot faster!
Come chat with us
We’d love to hear your feedback. If you’d like to share your feedback or to chat with our engineering team on how we can improve this tool, please fill out the survey below.
Nik Karpinsky
Principal Software Engineer Lead, Visual Studio Profiler
Follow
Recommend
About Joyk
Aggregate valuable and interesting links.
Joyk means Joy of geeK