

🏆 优化技术专题-Java技术体系方向-JVM虚拟机参数调优原理
source link: https://my.oschina.net/liboware/blog/5118385
Go to the source link to view the article. You can view the picture content, updated content and better typesetting reading experience. If the link is broken, please click the button below to view the snapshot at that time.

本文主要针对于综合层面上进行分析JVM优化方案总结和列举调优参数计划。主要包含:
- 调优之逃逸分析(栈上分配)
- 调优之线程局部缓存(TLAB)
- 调优之G1回收器
栈上分配与逃逸分析
-XX:+DoEscapeAnalysis
逃逸分析(Escape Analysis)
逃逸分析的基本行为就是分析对象动态作用域:当一个对象在方法中被定义后,它可能被外部方法所引用,称为方法逃逸。
方法逃逸的几种方式如下:
public class EscapeTest {

	public static Object obj;

    // 给全局变量赋值,发生逃逸
    public void globalVariableEscape() {
        obj = new Object();
    }

    // 方法返回值,发生逃逸
    public Object methodEscape() {
        return new Object();
    }

    // 实例引用发生逃逸
    public void instanceEscape() {
        test(this);
    }
}
栈上分配是Java虚拟机提供的一种优化技术
"对于那些线程私有的对象(指的是不可能被其他线程访问的对象),可以将它们直接分配在栈上,而不是分配在堆上"。
分配在栈上的好处:可以在函数调用结束后自行销毁,而不需要垃圾回收器的介入,减轻GC压力,从而提升系统的性能。
线程私有对象
-
受虚拟机栈空间的约束,适用小对象,大对象无法触发虚拟机栈上分配。
-
线程私有变量,大对象虚拟机会分配到TLAB中,TLAB(Thread Local Allocation Buffer)
-
在栈上分配该对象的内存,当栈帧从Java虚拟机栈中弹出,就自动销毁这个对象。减小垃圾回收器压力。
虚拟机内存逻辑图
JVM内存分配源码:
new关键字直接进行分配内存机制,源码如下:
CASE(_new): {
        u2 index = Bytes::get_Java_u2(pc+1);
        ConstantPool* constants = istate->method()->constants();
        // 如果目标Java类已经解析
        if (!constants->tag_at(index).is_unresolved_klass()) {
          // Make sure klass is initialized and doesn't have a finalizer
          Klass* entry = constants->slot_at(index).get_klass();
          assert(entry->is_klass(), "Should be resolved klass");
          Klass* k_entry = (Klass*) entry;
          assert(k_entry->oop_is_instance(), "Should be InstanceKlass");
          InstanceKlass* ik = (InstanceKlass*) k_entry;
          // 如果符合快速分配场景
          if ( ik->is_initialized() && ik->can_be_fastpath_allocated() ) {
            size_t obj_size = ik->size_helper();
            oop result = NULL;
            // If the TLAB isn't pre-zeroed then we'll have to do it
            bool need_zero = !ZeroTLAB;
            if (UseTLAB) {
              result = (oop) THREAD->tlab().allocate(obj_size);
            }
            // 如果TLAB分配失败,就在Eden区分配
            if (result == NULL) {
              need_zero = true;
              // Try allocate in shared eden
        retry:
              // 指针碰撞分配
              HeapWord* compare_to = *Universe::heap()->top_addr();
              HeapWord* new_top = compare_to + obj_size;
              if (new_top <= *Universe::heap()->end_addr()) {
                if (Atomic::cmpxchg_ptr(new_top, Universe::heap()->top_addr(), compare_to) != compare_to) {
                  goto retry;
                }
                result = (oop) compare_to;
              }
            }
            if (result != NULL) {
              // Initialize object (if nonzero size and need) and then the header
              // TLAB区清零
              if (need_zero ) {
                HeapWord* to_zero = (HeapWord*) result + sizeof(oopDesc) / oopSize;
                obj_size -= sizeof(oopDesc) / oopSize;
                if (obj_size > 0 ) {
                  memset(to_zero, 0, obj_size * HeapWordSize);
                }
              }
              if (UseBiasedLocking) {
                result->set_mark(ik->prototype_header());
              } else {
                result->set_mark(markOopDesc::prototype());
              }
              result->set_klass_gap(0);
              result->set_klass(k_entry);
              // 将对象地址压入操作数栈栈顶
              SET_STACK_OBJECT(result, 0);
              // 更新程序计数器PC,取下一条字节码指令,继续处理
              UPDATE_PC_AND_TOS_AND_CONTINUE(3, 1);
            }
          }
        }
        // Slow case allocation
        // 慢分配
        CALL_VM(InterpreterRuntime::_new(THREAD, METHOD->constants(), index),
                handle_exception);
        SET_STACK_OBJECT(THREAD->vm_result(), 0);
        THREAD->set_vm_result(NULL);
        UPDATE_PC_AND_TOS_AND_CONTINUE(3, 1);
      }
代码总体逻辑
JVM再分配内存时,总是优先使用快分配策略,当快分配失败时,才会启用慢分配策略。
- 如果Java类没有被解析过,直接进入慢分配逻辑。
- 快速分配策略,如果没有开启栈上分配或者不符合条件则会进行TLAB分配。
- 快速分配策略,如果TLAB分配失败,则尝试Eden区分配。
- 如果Eden区分配失败,则进入慢分配策略。
- 如果对象满足直接进入老年代的条件,那就直接进入老年代分配。
- 快速分配,对于热点代码,如果开启逃逸分析,JVM自会执行栈上分配或者标量替换等优化方案。
在某些场景使用栈上分配
设置JVM运行参数:
-Xmx10m -Xms10m -XX:+DoEscapeAnalysis -XX:-UseTLAB -XX:+PrintGC
开启逃逸模式,关闭TLAB
/**
 * @description 开启逃逸模式,关闭线程本地缓存模式(TLAB)(jdk1.8默认开启)
 * -Xmx10m -Xms10m    -XX:+DoEscapeAnalysis  -XX:-UseTLAB  -XX:+PrintGC
 */
public class AllocationOnStack {

    public static void main(String[] args) throws InterruptedException {
        long start = System.currentTimeMillis();
        for (int index = 0; index < 100000000; index++) {
            allocate();
        }
        long end = System.currentTimeMillis();
        System.out.println((end - start)+" ms");
        Thread.sleep(1000*1000);
        // 看后台堆情况,来佐证关闭逃逸优化后,是走的堆分配。
    }
    public static void allocate() {
        byte[] bytes = new byte[2];
        bytes[0] = 1;
        bytes[1] = 1;
    }
}
[GC (Allocation Failure)  2048K->520K(9728K), 0.0008938 secs]
[GC (Allocation Failure)  2568K->520K(9728K), 0.0006386 secs]
6 ms
jstat -gc pid
查看内存使用情况:
看出栈上分配机制的速度非常快,只需要6ms就完成了实现GC
调整JVM运行参数
关闭逃逸模式,开启TLAB
-Xmx10m -Xms10m -XX:-DoEscapeAnalysis -XX:+UseTLAB -XX:+PrintGC
查看内存使用情况:
[GC (Allocation Failure)  2048K->504K(9728K), 0.0013831 secs]
[GC (Allocation Failure)  2552K->512K(9728K), 0.0010576 secs]
[GC (Allocation Failure)  2560K->400K(9728K), 0.0022408 secs]
[GC (Allocation Failure)  2448K->448K(9728K), 0.0006095 secs]
[GC (Allocation Failure)  2496K->416K(9728K), 0.0010540 secs]
[GC (Allocation Failure)  2464K->464K(8704K), 0.0007620 secs]
[GC (Allocation Failure)  1488K->381K(9216K), 0.0007714 secs]
[GC (Allocation Failure)  1405K->381K(9216K), 0.0004409 secs]
[GC (Allocation Failure)  1405K->381K(9216K), 0.0004725 secs]
.......
[GC (Allocation Failure)  2429K->381K(9728K), 0.0008293 secs]
[GC (Allocation Failure)  2429K->381K(9728K), 0.0009006 secs]
[GC (Allocation Failure)  2429K->381K(9728K), 0.0005553 secs]
[GC (Allocation Failure)  2429K->381K(9728K), 0.0005077 secs]
894 ms
可以看出来,关闭了栈上分配后,不但YGC次数增加了,并且总体事件也变长了,总体事件894ms
调整JVM运行参数
-Xmx10m -Xms10m -XX:-DoEscapeAnalysis -XX:-UseTLAB -XX:+PrintGC
关闭逃逸,关闭TLAB
[GC (Allocation Failure)  2048K->472K(9728K), 0.0007073 secs]
[GC (Allocation Failure)  2520K->528K(9728K), 0.0009216 secs]
[GC (Allocation Failure)  2576K->504K(9728K), 0.0005897 secs]
[GC (Allocation Failure)  2551K->424K(9728K), 0.0005780 secs]
[GC (Allocation Failure)  2472K->440K(9728K), 0.0006923 secs]
[GC (Allocation Failure)  2488K->456K(8704K), 0.0006277 secs]
[GC (Allocation Failure)  1480K->389K(9216K), 0.0005560 secs]
.......
[GC (Allocation Failure)  2437K->389K(9728K), 0.0003227 secs]
[GC (Allocation Failure)  2437K->389K(9728K), 0.0004264 secs]
[GC (Allocation Failure)  2437K->389K(9728K), 0.0004396 secs]
[GC (Allocation Failure)  2437K->389K(9728K), 0.0002773 secs]
[GC (Allocation Failure)  2437K->389K(9728K), 0.0002766 secs]
1718 ms
查看内存使用情况:
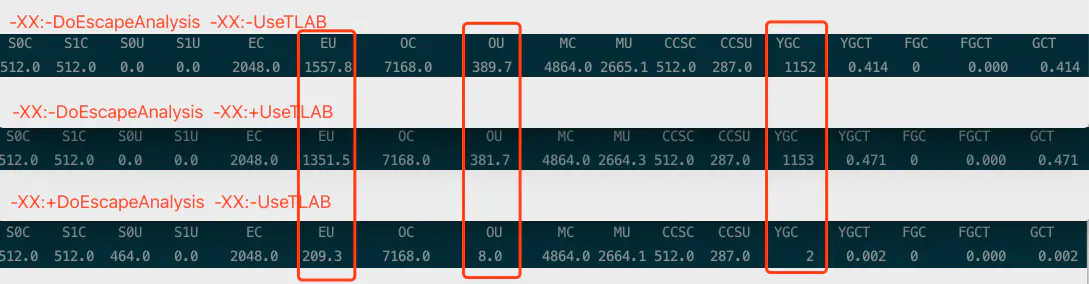
运行结果对比
- 运行耗时(开启逃逸 VS关闭逃逸(开启TLAB)VS关闭逃逸(关闭TLAB)): 6ms VS 894ms VS 1718ms
- 虚拟机内存&回收(开启逃逸VS关闭逃逸):
调整分配空间大小
/**
 * @since 2019/8/13  上午6:55
 * -Xmx10m -Xms10m    -XX:-DoEscapeAnalysis -XX:+UseTLAB  -XX:+PrintCommandLineFlags -XX:+PrintGC
 */
public class AllocationOnStack {

    private static final int _1B =  65;

    public static void main(String[] args) throws InterruptedException {
        long start = System.currentTimeMillis();
        for (int index = 0; index < 100000000; index++) {
            allocateBigSpace();
        }
        long end = System.currentTimeMillis();
        System.out.println(end - start);
        Thread.sleep(1000*1000);
        // 看后台堆情况,来佐证关闭逃逸优化后,是走的堆分配。
    }

    public static void allocate() {
        byte[] bytes = new byte[2];
        bytes[0] = 1;
        bytes[1] = 1;
    }
    public static void allocateBigSpace() {
        byte[] allocation1;
        allocation1 = new byte[1 * _1B];
    }
}
-XX:+DoEscapeAnalysis -XX:InitialHeapSize=5242880 -XX:MaxHeapSize=5242880 -XX:+PrintCommandLineFlags -XX:+PrintGC -XX:+UseCompressedClassPointers -XX:+UseCompressedOops -XX:+UseParallelGC -XX:-UseTLAB
[GC (Allocation Failure)  1023K->516K(5632K), 0.0028410 secs]
[GC (Allocation Failure)  1540K->578K(5632K), 0.0023265 secs]
........
[GC (Allocation Failure)  2466K->1442K(5632K), 0.0013395 secs]
[GC (Allocation Failure)  2466K->1442K(5632K), 0.0004367 secs]
8925
调整启动参数: -XX:+DoEscapeAnalysis -XX:-UseTLAB
运行结果:
-XX:+DoEscapeAnalysis -XX:InitialHeapSize=5242880 -XX:MaxHeapSize=5242880 -XX:+PrintCommandLineFlags -XX:+PrintGC -XX:+UseCompressedClassPointers -XX:+UseCompressedOops -XX:+UseParallelGC -XX:-UseTLAB
[GC (Allocation Failure)  1023K->516K(5632K), 0.0028410 secs]
[GC (Allocation Failure)  1540K->578K(5632K), 0.0023265 secs]
........
[GC (Allocation Failure)  2466K->1442K(5632K), 0.0013395 secs]
[GC (Allocation Failure)  2466K->1442K(5632K), 0.0004367 secs]
8925
经过对比得出结论:
分配内存为>64byte == -XX:-UseTLAB
经过多次测试发现当_1B=64b时效率还是非常高,一旦大于64b就会急剧下降。所以推断出64byte是JVM选择是TLAB分配 OR Eden区分配的临界值。
TLAB的基本介绍
TLAB(Thread Local Allocation Buffer)
线程本地分配缓存,这是一个线程独享的内存分配区域。
-
TLAB解决了:直接在线程共享堆上安全分配带来的线程同步性能消耗问题(解决了指针碰撞)。
-
TLAB内存空间位于Eden区。
-
默认TLAB大小为占用Eden Space的1%。
开启TLAB的参数
- -XX:+UseTLAB
- -XX:+TLABSize
- -XX:TLABRefillWasteFraction
- -XX:TLABWasteTargetPercent
- -XX:+PrintTLAB
TLAB的源码
TLAB的数据结构
class ThreadLocalAllocBuffer: public CHeapObj<mtThread> {
  HeapWord* _start;                              // address of TLAB
  HeapWord* _top;                                // address after last allocation
  HeapWord* _pf_top;                             // allocation prefetch watermark
  HeapWord* _end;                                // allocation end (excluding alignment_reserve)
  size_t    _desired_size;                       // desired size   (including alignment_reserve)
  size_t    _refill_waste_limit;                 // hold onto tlab if free() is larger than this
}
- _start 指TLAB连续内存起始地址。
- _top 指TLAB当前分配到的地址。
- _end 指TLAB连续内存截止地址。
- _desired_size 是指TLAB的内存大小。
- _refill_waste_limit 是指最大的浪费空间。默认值为64b
eg:假设为_refill_waste_limit=5KB:
-
假如当前TLAB已经分配96KB,还剩下4KB可分配,但是现在new了一个对象需要6KB的空间,显然TLAB的内存不够了,4kb<5kb这时只浪费4KB的空间,在_refill_waste_limit之内,这时可以申请一个新的TLAB空间,原先的TLAB交给Eden管理。
-
假如当前TLAB已经分配90KB,还剩下10KB,现在new了一个对象需要11KB,显然TLAB的内存不够了,这时就不能简单的抛弃当前TLAB,这11KB会被安排到Eden区进行申请。
-
obj_size + tlab_top <= tlab_end,直接在TLAB空间分配对象。
-
obj_size + tlab_top >= tlab_end && tlab_free > tlab_refill_waste_limit,
-
对象不在TLAB分配,在Eden区分配。(tlab_free:剩余的内存空间,tlab_refill_waste_limit:允许浪费的内存空间)
-
tlab剩余可用空间>tlab可浪费空间,当前线程不能丢弃当前TLAB,本次申请交由Eden区分配空间。
-
-
obj_size + tlab_top >= tlab_end && tlab_free < _refill_waste_limit,重新分配一块TLAB空间,在新的TLAB中分配对象。
- tlab剩余可用空间<tlab可浪费空间,在当前允许可浪费空间内,重新申请一个新TLAB空间,原TLAB交给Eden。
- 清单:/src/share/vm/memory/ThreadLocalAllocationBuffer.inline.hpp
- 功能:TLAB内存分配
inline HeapWord* ThreadLocalAllocBuffer::allocate(size_t size) {
  invariants();
  // 获取当前top
  HeapWord* obj = top();
  if (pointer_delta(end(), obj) >= size) {
    // successful thread-local allocation
#ifdef ASSERT
    // Skip mangling the space corresponding to the object header to
    // ensure that the returned space is not considered parsable by
    // any concurrent GC thread.
    size_t hdr_size = oopDesc::header_size();
    Copy::fill_to_words(obj + hdr_size, size - hdr_size, badHeapWordVal);
#endif // ASSERT
    // This addition is safe because we know that top is
    // at least size below end, so the add can't wrap.
    // 重置top
    set_top(obj + size);
    invariants();
    return obj;
  }
  return NULL;
}
实际上虚拟机内部会维护一个叫作refill_waste的值,当剩余对象空间大于refill_waste时,会选择在堆中分配,若小于该值,则会废弃当前TLAB,新建TLAB来分配对象。
这个阈值可以使用TLABRefillWasteFraction来调整,它表示TLAB中允许产生这种浪费的比例。
默认值为64,即表示使用约为1/64的TLAB空间作为refill_waste。
-
TLAB和refill_waste都会在运行时不断调整的,使系统的运行状态达到最优。
-
如果想要禁用自动调整TLAB的大小,可以使用-XX:-ResizeTLAB禁用ResizeTLAB
-
使用-XX:TLABSize手工指定一个TLAB的大小。
指针碰撞&Eden区分配
// 指针碰撞分配
HeapWord* compare_to = *Universe::heap()->top_addr();
HeapWord* new_top = compare_to + obj_size;
if (new_top <= *Universe::heap()->end_addr()) {
    if (Atomic::cmpxchg_ptr(new_top, Universe::heap()->top_addr(), compare_to) != compare_to) {
                  goto retry;
    }
    result = (oop) compare_to;
   }
}
Eden区指针碰撞,需要模拟多线程并发申请内存空间。
/**
 * @since 2019/8/19  下午11:25
-Xmx100m -Xms100m -XX:-DoEscapeAnalysis -XX:+UseTLAB
-XX:TLABWasteTargetPercent=1 -XX:+PrintCommandLineFlags  -XX:+PrintGCDetails
 */
public class AllocationTLABSomeThread {
    private static final int threadNum = 100;
    private static CountDownLatch latch = new CountDownLatch(threadNum);
    private static final int n = 50000000 / threadNum;

    private static void alloc() {
        byte[] b = new byte[100];
    }

    public static void main(String[] args) {
        long start = System.currentTimeMillis();
        for (int i = 0; i < threadNum; i++) {
            new Thread(() -> {
                for (int j = 0; j < n; j++) {
                    alloc();
                }
                latch.countDown();
            }).start();
        }
        try {
            latch.await();
        } catch (InterruptedException e) {
            System.out.println("hello world");
        }
        long end = System.currentTimeMillis();
        System.out.println(end - start);
    }

}
且需要关闭逃逸分析 -XX:-DoEscapeAnalysis -XX:+UseTLAB
-XX:-DoEscapeAnalysis -XX:InitialHeapSize=104857600 -XX:MaxHeapSize=104857600 -XX:+PrintCommandLineFlags -XX:+PrintGCDetails -XX:TLABWasteTargetPercent=1 -XX:+UseCompressedClassPointers -XX:+UseCompressedOops -XX:+UseParallelGC -XX:+UseTLAB
[GC (Allocation Failure) [PSYoungGen: 25600K->960K(29696K)] 25600K->968K(98304K), 0.0019559 secs] [Times: user=0.01 sys=0.00, real=0.00 secs]
[GC (Allocation Failure) [PSYoungGen: 26560K->960K(29696K)] 26568K->968K(98304K), 0.0022243 secs] [Times: user=0.01 sys=0.00, real=0.00 secs]
[GC (Allocation Failure) [PSYoungGen: 26560K->768K(29696K)] 26568K->776K(98304K), 0.0022446 secs] [Times: user=0.00 sys=0.00, real=0.00 secs]
........
[GC (Allocation Failure) [PSYoungGen: 32768K->0K(33280K)] 34193K->1425K(101888K), 0.0014598 secs] [Times: user=0.01 sys=0.00, real=0.00 secs]
[GC (Allocation Failure) [PSYoungGen: 32768K->0K(33280K)] 34193K->1425K(101888K), 0.0015168 secs] [Times: user=0.00 sys=0.01, real=0.00 secs]
823
Heap
 PSYoungGen      total 33280K, used 3655K [0x00000007bdf00000, 0x00000007c0000000, 0x00000007c0000000)
  eden space 32768K, 11% used [0x00000007bdf00000,0x00000007be291c48,0x00000007bff00000)
  from space 512K, 0% used [0x00000007bff80000,0x00000007bff80000,0x00000007c0000000)
  to   space 512K, 0% used [0x00000007bff00000,0x00000007bff00000,0x00000007bff80000)
 ParOldGen       total 68608K, used 1425K [0x00000007b9c00000, 0x00000007bdf00000, 0x00000007bdf00000)
  object space 68608K, 2% used [0x00000007b9c00000,0x00000007b9d64798,0x00000007bdf00000)
 Metaspace       used 4255K, capacity 4718K, committed 4992K, reserved 1056768K
  class space    used 477K, capacity 533K, committed 640K, reserved 1048576K
关闭逃逸和TLAB分配 -XX:-DoEscapeAnalysis -XX:-UseTLAB 运行结果:
-XX:-DoEscapeAnalysis -XX:InitialHeapSize=104857600 -XX:MaxHeapSize=104857600 -XX:+PrintCommandLineFlags -XX:+PrintGCDetails -XX:TLABWasteTargetPercent=1 -XX:+UseCompressedClassPointers -XX:+UseCompressedOops -XX:+UseParallelGC -XX:-UseTLAB
[GC (Allocation Failure) [PSYoungGen: 25599K->976K(29696K)] 25599K->984K(98304K), 0.0023516 secs] [Times: user=0.01 sys=0.00, real=0.00 secs]
[GC (Allocation Failure) [PSYoungGen: 26575K->880K(29696K)] 26583K->888K(98304K), 0.0015459 secs] [Times: user=0.01 sys=0.00, real=0.00 secs]
[GC (Allocation Failure) [PSYoungGen: 26480K->832K(29696K)] 26488K->840K(98304K), 0.0006776 secs] [Times: user=0.00 sys=0.00, real=0.00 secs]
.......
[GC (Allocation Failure) [PSYoungGen: 32767K->0K(33280K)] 34053K->1285K(101888K), 0.0004838 secs] [Times: user=0.00 sys=0.00, real=0.00 secs]
[GC (Allocation Failure) [PSYoungGen: 32767K->0K(33280K)] 34053K->1285K(101888K), 0.0005389 secs] [Times: user=0.00 sys=0.00, real=0.01 secs]
5388
Heap
 PSYoungGen      total 33280K, used 21392K [0x00000007bdf00000, 0x00000007c0000000, 0x00000007c0000000)
  eden space 32768K, 65% used [0x00000007bdf00000,0x00000007bf3e4230,0x00000007bff00000)
  from space 512K, 0% used [0x00000007bff00000,0x00000007bff00000,0x00000007bff80000)
  to   space 512K, 0% used [0x00000007bff80000,0x00000007bff80000,0x00000007c0000000)
 ParOldGen       total 68608K, used 1285K [0x00000007b9c00000, 0x00000007bdf00000, 0x00000007bdf00000)
  object space 68608K, 1% used [0x00000007b9c00000,0x00000007b9d41788,0x00000007bdf00000)
 Metaspace       used 4248K, capacity 4718K, committed 4992K, reserved 1056768K
  class space    used 478K, capacity 533K, committed 640K, reserved 1048576K
经过对比,相差7倍左右。二者内存回收♻️,从YoungGC次数和耗时上没有太大变化:应为都是Eden区分配。
G1垃圾回收过程
触发混合回收条件:
-XX:InitiatingHeapOccupancyPercent=45 ,当老年代空间使用占整个堆空间45%时。
混合回收范围:
新生代、老年代、大对象。
混合回收过程:
初始标记:
-
这个过程会STW,停止系统线程。
-
标记GC-Roots的直接引用对象。
- 线程栈中局部变量表 。
- 方法区中的静态变量/常量等。
- 本地方法栈。
- 特点:速度极快。
- 这个过程不会STW,系统线程正常运行。
- 从第一阶段标记的GC-Roots开始追踪所有存活对象。
- 特点:慢,很耗时。
- 优化:JVM会对“并发标记”阶段新产生的对象及对象修改做记录(RememberSet)
最终标记:
- 这个过程会STW,系统线程停止运行。
- 会根据“并发标记”阶段记录的RememberSet进行对象标记。
- 特点:很快。
- RememberSet相当于是拿空间换时间。
混合回收:
- 这个过程会STW,系统线程停止运行。
- 会计算老年代中每个Region中存活对象数量,存活对象占比,执行垃圾回收预期耗时和效率。
-
耗时:会根据启动参数中
-XX:MaxGCPauseMillis=200和历史回收耗时来计算本次要回收多少老年代Region才能耗时200ms。 -
特点:回收了一部分远远没有达到回收的效果,G1还有一个特殊处理方法,STW后进行回收,然后恢复系统线程,然后再次STW,执行混合回收掉一部分Region,
‐XX:G1MixedGCCountTarget=8(默认是8次),反复执行上述过程8次。
注意:假设要回收400个Region,如果受限200ms,每次只能回收50个Region,反复8次刚好全部回收完毕。这么做的好处是避免单次停顿回收STW时间太长。
-
**还有一个参数要提一下
‐XX:G1HeapWastePercent=5 (默认是5%)。- 混合回收是采用复制算法,把要回收的Region中存活的对象放入其他Region中。
- 然后这个Region中的垃圾全部清理掉,这样就会不断有Region释放出来,当释放出的Region占整个堆空间5%时,停止混合回收。
-
还有一个参数:
‐XX:G1MixedGCLiveThresholdPercent=85 (默认值85%)。回收Region的时候,必须是存活对象低于85%。
混合回收失败时:
-
在Mixed回收的时候,无论是年轻代还是老年代都是基于复制算法进行回收,都要把各个Region的存活对象拷贝到另外其他的Region里去,万一拷贝是发生空间不足,就会触发一次失败。
-
一旦回收失败,立马就会切换采用Serial 单线程进行标记+清理+整理,整个过程是非常慢的(灾难)。
Recommend
About Joyk
Aggregate valuable and interesting links.
Joyk means Joy of geeK