
4

几何级数增长应该怎样用图形表达
source link: https://yihui.org/cn/2008/10/demonstrate-geometric-growth-in-graphics/
Go to the source link to view the article. You can view the picture content, updated content and better typesetting reading experience. If the link is broken, please click the button below to view the snapshot at that time.

几何级数增长应该怎样用图形表达
谢益辉 / 2008-10-29
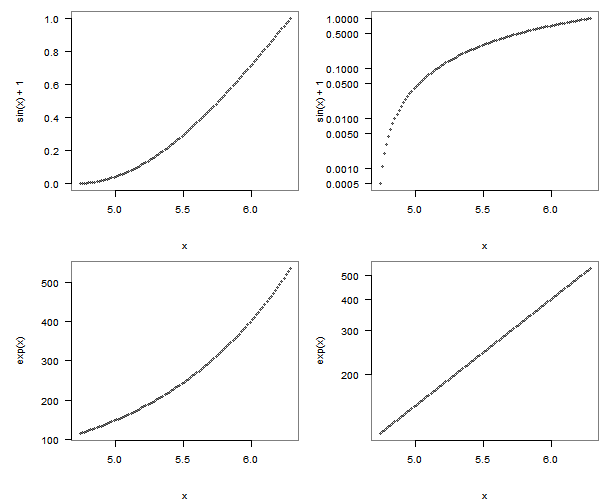
今日在北大听史密斯商学院创业大赛报告,其中有一位参赛者幻灯片中提到了他们的用户数这几年呈几何级数增长,并拿用户数和时间作了一幅图,图中线条呈现出增长越来越快的趋势,其实这种做法有糊弄之嫌 —— 增长越来越快的并不一定是几何级数增长方式。例如 y = sin (x) + 1 在 [1.5π, 2π] 区间上增长也是越来越快,但它并非几何级数。
表达几何级数增长(或者指数增长)的方式一般是对 y 取对数,然后与 x 作图,看图形是否呈一条直线:若 log (y) = a * x + b,那么显然是指数增长方式。人眼观察直线比观察曲线要容易得多,因此这种方法比用原始数据作图要更容易表达 “几何级数增长”。下图左边为原始数据,右边为 y 轴取对数后的图形。R 中处理起来非常简单,作图时添加参数 log 即可(可以对 x 轴或 y 轴或者同时取对数)。
# png("exp_growth.png", width = 600, height = 500)
options(scipen = 5)
x = seq(1.51 * pi, 2 * pi, length = 100)
par(mfrow = c(2, 2), pch = 20, mar = c(5, 6, 1, 0.1),
    col = rgb(0, 0, 0, 0.5), las = 1, mgp = c(4, 1, 0))
plot(x, sin(x) + 1)
plot(x, sin(x) + 1, log = "y")
plot(x, exp(x))
plot(x, exp(x), log = "y")
# dev.off()
← 送给 Felix 的一万天 “生日” 小礼 邮件应该怎样发(格式问题) →
Disqus
Utterances
Preferences
© Yihui Xie 2005 - 2020
Recommend
About Joyk
Aggregate valuable and interesting links.
Joyk means Joy of geeK