

6 Competitor Insights You Can Get in 30 Minutes
source link: https://www.semrush.com/blog/6-competitor-insights-you-can-get-in-30-minutes-1/
Go to the source link to view the article. You can view the picture content, updated content and better typesetting reading experience. If the link is broken, please click the button below to view the snapshot at that time.

6 Competitor Insights You Can Get in 30 Minutes
Feb 24, 20218 min readExperienced marketers know their company’s rivals inside and out, and they know that there are always more competitive insights to discover. From marketing trends to competitive landscape analysis, traffic dynamics within your market and its key players can uncover a lot.
Let’s look at some of the more complex findings that your rivals’ website traffic metrics can deliver. Set your clock: we have 30 minutes and 6 hidden points to reveal.
The insights below were found with the help of Market Explorer and Traffic Analytics.
If you want to learn how to reveal specific website traffic metrics of your competitors, please refer to this article.
Competitive Insight #1: Who is Really Leading the Market?
When planning a marketing campaign, you may be looking at your company’s main rival for insights and strategies, but are you looking at everything you should?
If you only judge your competitors by brand awareness, estimated market share, or frequency of PR appearances, you may be missing the competitor who has the best reach and traffic.
A better strategy to find a legitimate digital benchmark is to check out the top 5 competitors that are neck and neck with you.
Identify the one with the highest traffic volume in the last 12 months; note whether they showed exponential or stable growth over the year and if they had any decreases over the period. Whether it correlates with offline popularity or not, take this company’s website as a benchmark and build your campaigns with an understanding of their successful and unsuccessful activities.
Let's look at some example data below:
In a quest for competitive market analysis, we simply took the biggest-on-the-market food delivery brand, Domino’s, and entered it into Market Explorer.
The tool automatically gathers the top market players within your industry, showing their traffic, aka online market, share while also reflecting their QoQ, or YoY growth/decline dynamics :
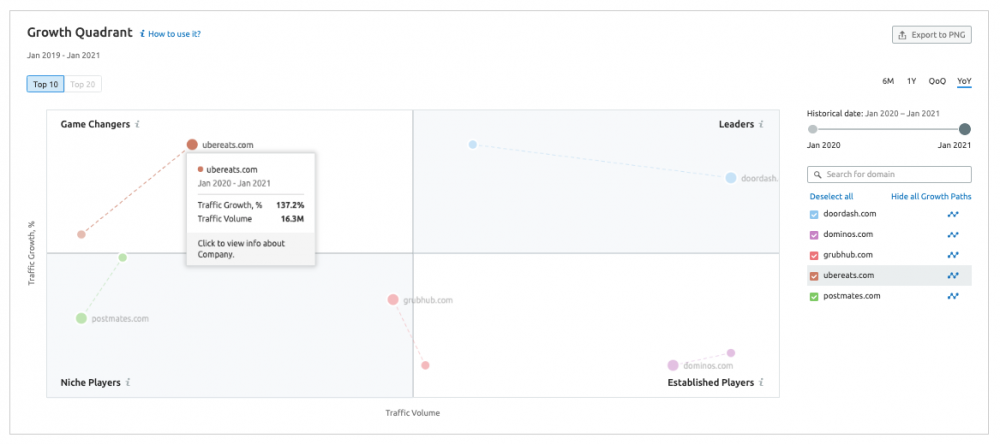
The Growth Quadrat widget places your competitors within four categories:
-
Game-Changers: sites that are getting big visitor spikes within a short timeframe yet overall have a lower traffic share.
-
Leaders: sites that have both the volume and the traffic growth dynamics.
-
Niche Players: sites with both lower-traffic-share and slower-than-average online market growth.
-
Established Players: sites with a relatively large online market share but lower traffic growth rate.
Further along, make sure to check the companies’ traffic sources and be aware of the one that drives the most traffic.
You don’t have to go anywhere else in search of this data - Market Explorer dissects your rivals’ key traffic sources and gives a breakdown of each channel’s impact.
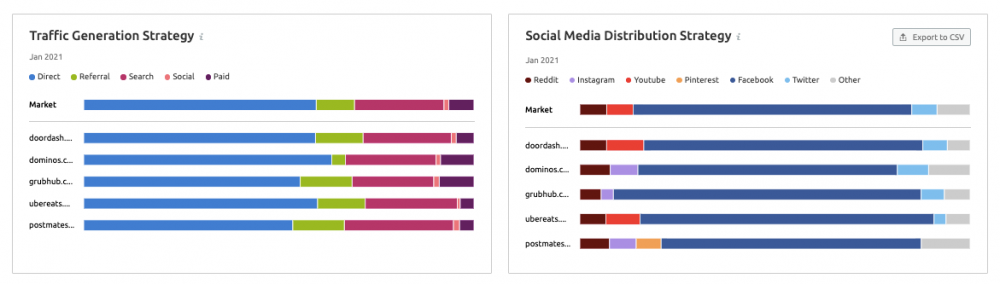
It’s clear that within top food delivery brands, direct is the biggest traffic driver, so it only makes sense to invest in SEO and marketing campaigns that bring high brand awareness.
Here, Domino’s certainly attracts the most direct traffic. Postmates, however, has the biggest share of visits coming from search, which implies that it relies less on promo and puts more emphasis on SEO.
Postmates, unlike the rest, places a much bigger bet on social, and this certainly pays off - the brand gets almost triple the traffic from social media compared to the others. In fact, they are the only ones investing in Pinterest, which brings an impressive share of visits to their site.
If you spot greater shares of paid and referral traffic, this may indicate the companies that are more effective in their advertising and PR.
This is how, essentially, in less than 5 minutes, we researched traffic volume amongst food delivery services in the US. This way, using Semrush’s Market Explorer tool, you can determine the leader in any other industry, too.
Keep in mind that when doing competitive and market research, you may want to concentrate on relative numbers, not absolute, especially if you are looking for a benchmark for a particular traffic source.
Competitive Insight #2: What Hidden Seasonal Trends Might You Overlook?
You may know all the industry peaks and declines in demand, but you still have to learn the seasonality that exists for some companies.
Sometimes it is the budget that remains at the end of a quarter and needs to be spent, so you see lots of paid traffic going to the website during this time. Or it could be the case that a new head of marketing has arrived with fresh ideas, and made everyone turn their attention to blogger relations, for example.
Be sure to check traffic metrics over current and previous years. For both, determine your main competitor’s peak month (by the number of website visits). Then compare data and see if it is the same for the overall market and other industry players, and identify the reasons for such an increase. Repeat the same procedure for the period of decline.
Once you have learned how your competitors’ campaigns worked in a low season, you will be able to conclude whether enhanced promotion in this period will be a payoff or a waste.
Let’s continue with the example of food delivery services in the US.
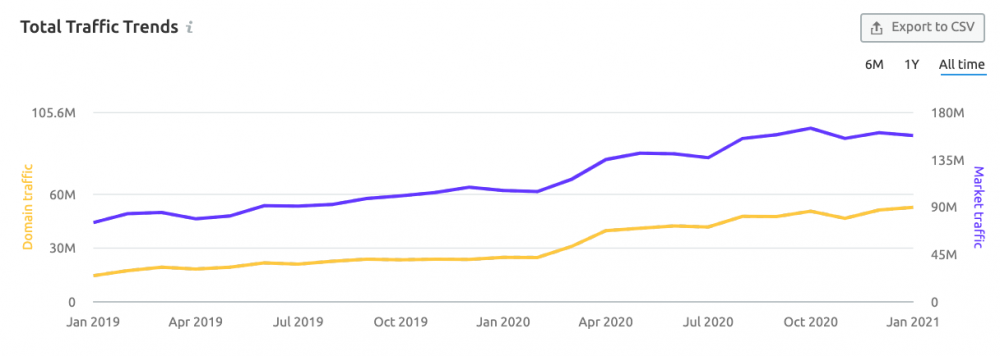
For the five chosen websites, December looks like the high season — the amount of traffic tends to consistently rise during the holiday month, regardless of the overall pandemic-related visits surge.
To determine that this is neither an accident nor a result of individual competitors’ promos, we will refer to Semrush Market Explorer.
We see here that Domino’s peaks and declines are similar to the total market trends. This means the fluctuation must have been caused by consumer preferences, rather than companies’ marketing activities. So, it’s the audience that has to be researched next.
Competitive Insight #3: Do Your Rivals Really Hit the Same Target Audience?
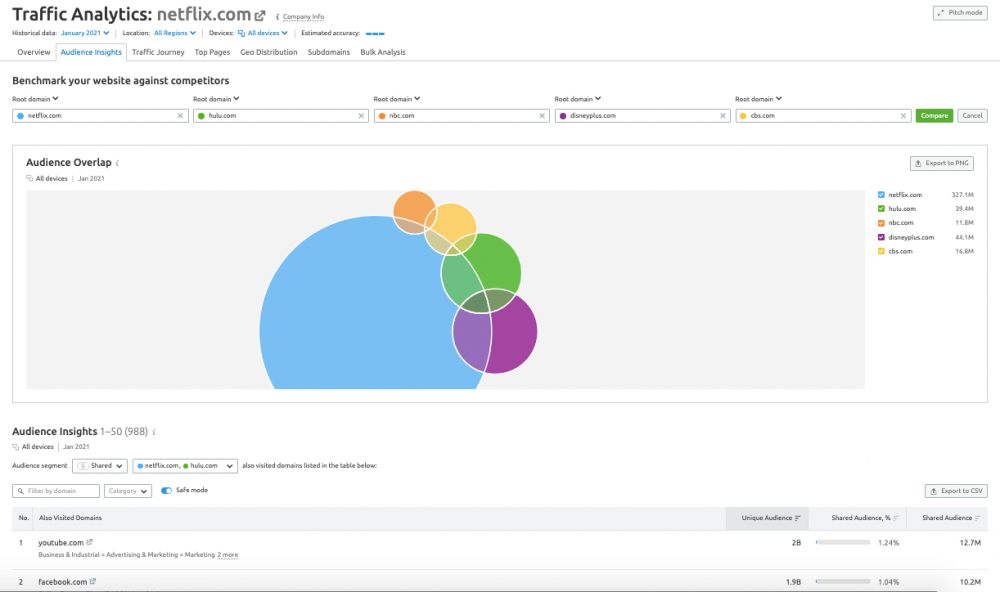
The most important question is not even who your rivals target, but who they actually hit. To reveal this, study the audience overlap between your competitors with the help of Traffic Analytics.
The percentage of shared vs. unique audience you find can help you discover the current or even the next leader of the competition, compare brands’ positioning and marketing strategies, reveal media preferences and align your campaigns accordingly.
Let's look at 5 popular streaming sites as an example.
If you look at their home pages, you may notice they are all alike, as they all keep releasing fresh films, shows, and other content types throughout the day. If you look at their actual audience overlap, though, you will see the difference in these platforms’ viewership.
If you get into a situation like this with your competitor, you may want to increase the number of media placements that you share with them (if you are serious about getting their piece of pie) or try to avoid them in the future (to differentiate your audiences).
Competitive Insight #4: Does Your Competitor Communicate With the Target Audience Better than You Do?
Pure traffic numbers can only reveal so much about the brand’s success online. If a company doesn’t provide what users want on its website, users leave; it’s that simple. So, turn to Traffic Analytics once again to uncover your competitor’s key user engagement - the average visit duration and bounce rate.
We studied the top US home and garden decor e-commerces as an example below and discovered that HomeDepot, while being the leader in traffic volume, managed to keep a comparatively low average visit duration. Its competitor, Wayfair, appears to receive highly relevant traffic to its website, too, judging by its long average visit duration and lower-than-average bounce rate.
Another competitor, Lowe’s, can boast relatively large levels of traffic, yet really fails when it comes to favorable user engagement metrics.
What should you do if you research the same metrics for your niche and discover that a competitor has outperformed you?
Check their website traffic journey to reveal the channels and media platforms that attract such a well-targeted audience. Also, have a look at their subdomains and top pages (it may be the structure and content of the website that users find so appealing), and take inspiration from their activities.
Competitive Insight #5: The Top Products and How Your Rivals Manage to Drive Target Users to Them?
Once you have an understanding that you share a certain volume of the same users, it’s interesting to look at your competitors’ top products/services and uncover which marketing channels are working out as the best traffic-drivers.
Using Traffic Analytics, we can cover both areas.
Say, you’re in the luxury bag industry, and Prada is your biggest rival. By looking at the Top Pages report which reveals the most visited pages of your competitor’s site, we can see that past the obvious home pages, the most popular section has to do with shoulder bags. This implies that around 1% of all Prada visits go to this bag category.
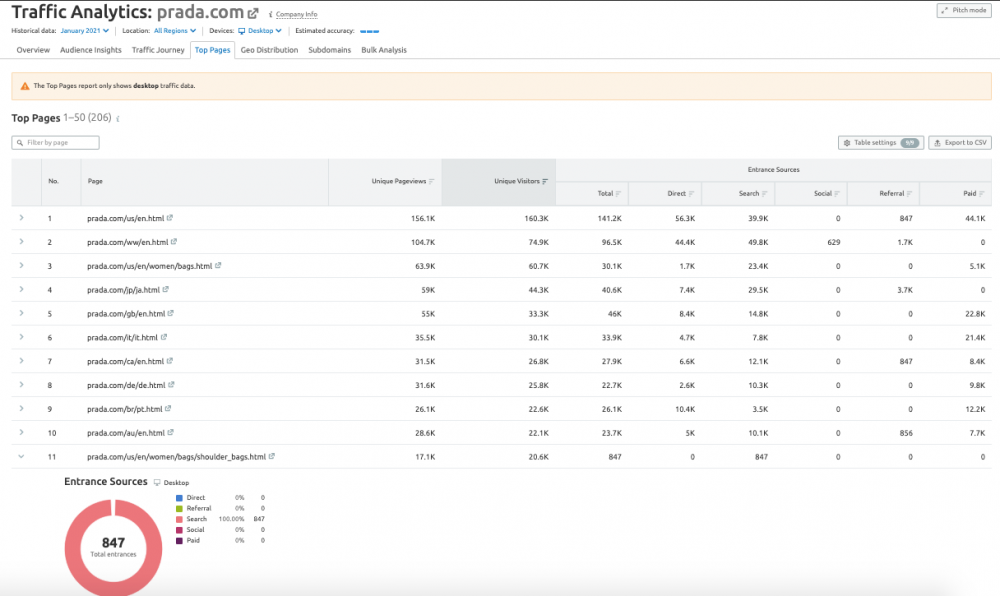
And when you know which product is getting the biggest traction among potentially your target audience, you can, then, simply expand the report and unwrap which external sources are bringing in all the traffic to a given page.
In Prada’s shoulder bag case, we can see that search is the only entrance source for that page. This means that when thinking of an audience generation strategy for this category, the brand is placing its biggest bet on SEO while other page views come from site structure and internal links.
So, if you’re willing to get a share of Prada’s shoulder-bag-interested audience, you might want to amplify your SEO strategy to be able to compete with this fashion giant.
Competitive Insight #6: What is Their Estimated Conversion?*
*For e-commerce websites and online-based companies only
If users got to a webpage that was made for confirming a purchase or even entering their bank details, there is a good chance they actually bought something.
So, armed with insights from the Traffic Analytics tool, check the traffic to the Top Pages related to payment — filter the complete list by “pay”, “checkout”, “secure”, or even “thank-you”. These won’t be exact numbers, but you should get some general understanding.
Similarly, you can also find out the total number of users that signed up, logged in, or took specific actions on an online platform.
Here is what we discovered about paypal.com:
There are even more insights you can reveal with Semrush Traffic Analytics and Market Explorer. Please share yours in the comments below.
Enhance your team with intelligence
Try the Semrush Competitive Research Solution

Recommend
About Joyk
Aggregate valuable and interesting links.
Joyk means Joy of geeK