
9

可视化篇(四)——— python绘制双y轴、箱线图、概率分布三种图形及案例
source link: https://blog.csdn.net/Cyrus_May/article/details/113133679
Go to the source link to view the article. You can view the picture content, updated content and better typesetting reading experience. If the link is broken, please click the button below to view the snapshot at that time.

可视化篇(四)——— python绘制双y轴、箱线图、概率分布三种图形及案例
本文演示了如何通过python绘制双y轴、箱线图、概率分布三种图形,并给出了具体案例供读者参考。
绘制双y轴图形
效果图如下
代码如下
import numpy as np
import matplotlib.pyplot as plt
from matplotlib.font_manager import FontProperties
import datetime

# 此设置为使图形能显示带特殊格式的字符
plt.rcParams['axes.unicode_minus'] = False

# 构建虚拟数据
"""
x轴为日期
左y轴为y1,y2
右y轴为 y1-y2 及其均值
"""
date = [(datetime.datetime.strptime("2019-12-08 00:00:00","%Y-%m-%d %H:%M:%S") + datetime.timedelta(days=i)).strftime("%Y-%m-%d%H:%M:%S")[:10] for i in range(300)]
x = np.arange(300)
x_ticks = [int(i) for i in np.linspace(0, (x.shape[0] - 1), 5)]
y1 = np.random.randn(300) *2 + 75
y2 = np.random.randn(300) *2 + 70

# 设置字体
font = FontProperties(fname="C:\Windows\Fonts\simsun.ttc", size=30)

figure = plt.figure(figsize=[30, 16], dpi=72)

ax1 = figure.add_subplot(111)

fig1 = ax1.plot(x, y1, color="c", label="y1")
fig2 = ax1.plot(x, y2, color="b", label="y2")
plt.yticks(fontproperties=font)
plt.xlabel("date", fontproperties=FontProperties(fname="C:\Windows\Fonts\simsun.ttc", size=45))
plt.xticks(x_ticks, date, fontproperties=FontProperties(fname="C:\Windows\Fonts\simsun.ttc", size=30), rotation=15)
ax1.set_ylim(40, 83)
ax1.set_ylabel("y", fontproperties=FontProperties(fname="C:\Windows\Fonts\simsun.ttc", size=45))

ax2 = ax1.twinx()

fig3 = ax2.plot(x, y1-y2, color="m", label="y1-y2")
fig4 = ax2.plot(x, [(y1-y2).mean()] * (x.shape[0]), color="g", linestyle="--", linewidth=5, label="mean of y1-y2")
ax2.set_ylim(-5, 40)
ax2.set_ylabel("y1-y2", fontproperties=FontProperties(fname="C:\Windows\Fonts\simsun.ttc", size=45))
plt.yticks(fontproperties=font)

# 显示均值
ax2.text(x.shape[0], (y1-y2).mean() - 0.1, str((y1-y2).mean())[:4], fontdict={"size": 30, "color": "g"})

# 设置图列
legends = fig1 + fig2 + fig3 + fig4
labels = [l.get_label() for l in legends]
plt.legend(legends, labels, prop=font, loc=(0.8, 0.4))

plt.show()
绘制箱线图
效果图如下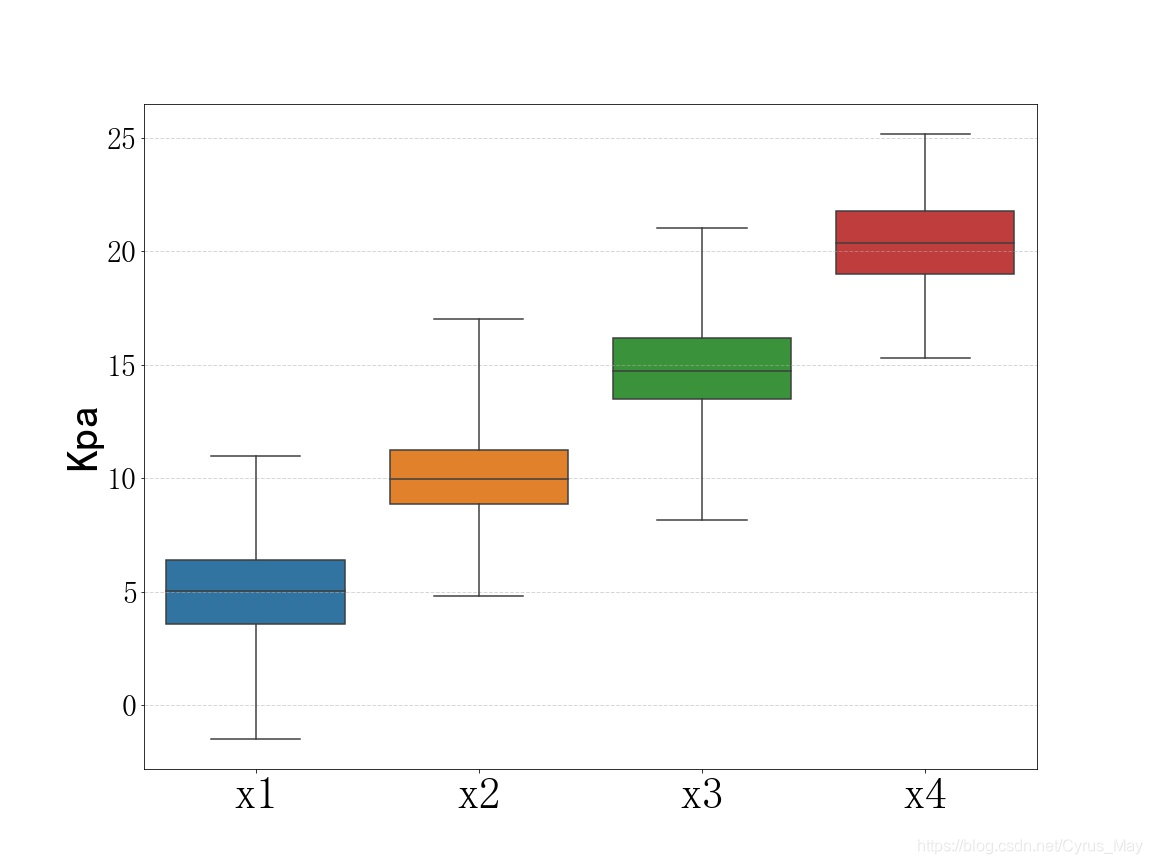
代码如下
import numpy as np
import matplotlib.pyplot as plt
from matplotlib.font_manager import FontProperties
import seaborn as sns
import pandas as pd

# 此设置为使图形能显示带特殊格式的字符
plt.rcParams['axes.unicode_minus'] = False

# 构建虚拟数据
"""
绘制x1,x2,x3,x4四组数据的箱线图
"""
x1 = np.random.randn(200)*2+5
x2 = np.random.randn(200)*2+10
x3 = np.random.randn(200)*2+15
x4 = np.random.randn(200)*2+20
data = np.array([x1,x2,x3,x4]).T
df = pd.DataFrame(data,columns=["x1","x2","x3","x4"])

font = FontProperties(fname = "C:\Windows\Fonts\simsun.ttc",size=30)
figure = plt.figure(figsize=[16,12],dpi=72)

# whis为异常值在上下四分位点差值的多少倍以外
sns.boxplot(data = df, whis=3, orient="v", fliersize=15)
plt.ylabel("Kpa", fontproperties=FontProperties(fname="C:\Windows\Fonts\simhei.ttf", size=45))
plt.yticks(fontproperties=font)
plt.xticks(fontproperties = FontProperties(fname = "C:\Windows\Fonts\simsun.ttc",size=45))
plt.grid(linestyle="--", linewidth=1, alpha=0.5, axis="y")
plt.show()
绘制概率分布图
效果图如下
代码如下
import numpy as np
import matplotlib.pyplot as plt
from matplotlib.font_manager import FontProperties
import seaborn as sns

# 此设置为使图形能显示带特殊格式的字符
plt.rcParams['axes.unicode_minus'] = False

# 构建虚拟数据
"""
绘制x的概率分布图
"""
x = np.random.randn(1000)*2+100
figure = plt.figure(figsize=[30,26],dpi=72)
sns.distplot(x,bins=30,kde_kws={"color":"red"},color="c")
plt.xticks(fontproperties=FontProperties(fname="C:\Windows\Fonts\simsun.ttc",size=30))
plt.yticks(fontproperties=FontProperties( fname="C:\Windows\Fonts\simsun.ttc",size=30))
plt.xlabel(xlabel="活化能",fontproperties = FontProperties( fname="C:\Windows\Fonts\simsun.ttc",size=45))
plt.ylabel("概率密度",fontproperties = FontProperties( fname="C:\Windows\Fonts\simsun.ttc",size=45))

plt.show()
by CyrusMay 2021 01 25
脱下长日的假面
奔向梦幻的疆界
南瓜马车的午夜
换上童话的玻璃鞋
——————五月天(拥抱)——————
Recommend
About Joyk
Aggregate valuable and interesting links.
Joyk means Joy of geeK