
12

linux flamegraph火焰图使用
source link: https://blog.csdn.net/oqqYuan1234567890/article/details/105444463
Go to the source link to view the article. You can view the picture content, updated content and better typesetting reading experience. If the link is broken, please click the button below to view the snapshot at that time.

perf可以忽略语言或者一些开发框架,从os的角度看到进程的cpu时间都耗费在哪些调用栈上。
perf与火焰图搭配使用,提供一个比较友好的交互方式,来观察调用栈的耗时
验证环境是ubuntu环境
安装perf
$ sudo apt install linux-tools-common
# 装完使用perf的时候,提示还需要安装其它包
$ sudo apt install linux-tools-4.15.0-91-generic linux-cloud-tools-4.15.0-91-generic
装完之后就可以使用perf命令了。
常用的命令:是 perf record命令,help一下,可以发现
$ perf record -h

 Usage: perf record [<options>] [<command>]
    or: perf record [<options>] -- <command> [<options>]

    -a, --all-cpus        system-wide collection from all CPUs
    -b, --branch-any      sample any taken branches
    -B, --no-buildid      do not collect buildids in perf.data
    -c, --count <n>       event period to sample
    -C, --cpu <cpu>       list of cpus to monitor
    -d, --data            Record the sample addresses
    -D, --delay <n>       ms to wait before starting measurement after program s
    -e, --event <event>   event selector. use 'perf list' to list available even
    -F, --freq <n>        profile at this frequency
    -g                    enables call-graph recording
    -G, --cgroup <name>   monitor event in cgroup name only
    -I, --intr-regs[=<any register>]
                          sample selected machine registers on interrupt, use -I
    -i, --no-inherit      child tasks do not inherit counters
    -j, --branch-filter <branch filter mask>
                          branch stack filter modes
    -k, --clockid <clockid>
                          clockid to use for events, see clock_gettime()
    -m, --mmap-pages <pages[,pages]>
                          number of mmap data pages and AUX area tracing mmap pa
    -N, --no-buildid-cache
                          do not update the buildid cache
    -n, --no-samples      don't sample
    -o, --output <file>   output file name
    -P, --period          Record the sample period
    -p, --pid <pid>       record events on existing process id
    -q, --quiet           don't print any message
    -R, --raw-samples     collect raw sample records from all opened counters
    -r, --realtime <n>    collect data with this RT SCHED_FIFO priority
    -S, --snapshot[=<opts>]
                          AUX area tracing Snapshot Mode
    -s, --stat            per thread counts
    -t, --tid <tid>       record events on existing thread id
    -T, --timestamp       Record the sample timestamps
    -u, --uid <user>      user to profile
    -v, --verbose         be more verbose (show counter open errors, etc)
    -W, --weight          sample by weight (on special events only)
        --all-kernel      Configure all used events to run in kernel space.
        --all-user        Configure all used events to run in user space.
        --buildid-all     Record build-id of all DSOs regardless of hits
        --call-graph <record_mode[,record_size]>
                          setup and enables call-graph (stack chain/backtrace):

                                record_mode:    call graph recording mode (fp|dw
                                record_size:    if record_mode is 'dwarf', max s
                                                default: 8192 (bytes)

                                Default: fp
        --clang-opt <clang options>
                          options passed to clang when compiling BPF scriptlets
        --clang-path <clang path>
                          clang binary to use for compiling BPF scriptlets
        --dry-run         Parse options then exit
        --exclude-perf    don't record events from perf itself
        --filter <filter>
                          event filter
        --group           put the counters into a counter group
        --namespaces      Record namespaces events
        --no-buffering    collect data without buffering
        --overwrite       use overwrite mode
        --per-thread      use per-thread mmaps
        --phys-data       Record the sample physical addresses
        --proc-map-timeout <n>
                          per thread proc mmap processing timeout in ms
        --running-time    Record running/enabled time of read (:S) events
        --sample-cpu      Record the sample cpu
        --switch-events   Record context switch events
        --switch-output[=<signal,size,time>]
                          Switch output when receive SIGUSR2 or cross size,time
        --tail-synthesize
                          synthesize non-sample events at the end of output
        --timestamp-filename
                          append timestamp to output filename
        --transaction     sample transaction flags (special events only)
        --user-regs[=<any register>]
                          sample selected machine registers on interrupt, use -I
        --vmlinux <file>  vmlinux pathname
安装flamegraph
火焰图是脚本,只需要下载
$ git clone https://github.com/brendangregg/FlameGraph.git
perf的教程主要参考 http://www.brendangregg.com/perf.html
火焰图的教程主要参考 http://www.brendangregg.com/flamegraphs.html
# -F是每秒的采样次数 -p 是进程id, -a 是采集所有cpu, -g是记录调用依赖关系,sleep
$ sudo perf record -F 99 -p 85356  -a -g -- sleep 10
# 上一步会在当前目录生成 perf.data文件,需要转化为profile未见
$  sudo perf script > out.perf
# 生成一个中间文件 out.folded
$ ./FlameGraph/stackcollapse-perf.pl out.perf > out.folded
# out.svg就是我们要的火焰图文件,可以用浏览器打开
$ ./FlameGraph/flamegraph.pl out.folded > out.svg
用浏览器打开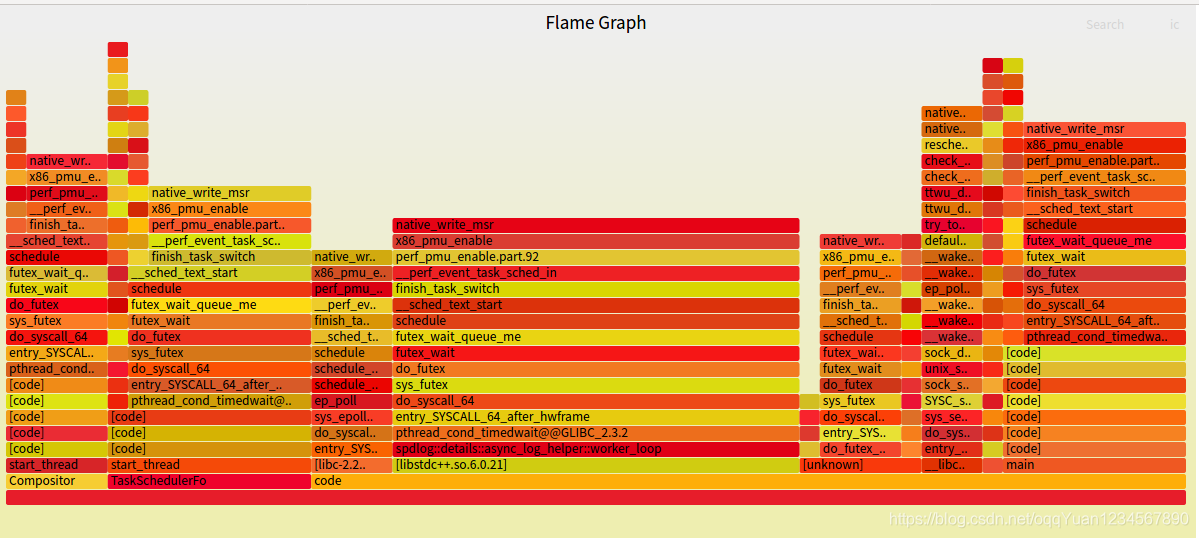
火焰图怎么看?
教程是这样说的
The x-axis shows the stack profile population, sorted alphabetically (it is not the passage of time), and the y-axis shows stack depth, counting from zero at the bottom. Each rectangle represents a stack frame. The wider a frame is is, the more often it was present in the stacks. The top edge shows what is on-CPU, and beneath it is its ancestry. The colors are usually not significant, picked randomly to differentiate frames.
- x轴是按照字母排列的profile调用栈信息
- y轴代表栈深度。每个矩形代表一个栈帧,矩形越宽,说明调用越频繁。
上下矩形具有祖先关系,下面矩形是上面矩形的祖先,调用关系的表现在这。 - 颜色是随机的,没有意义。
火焰图就是看顶层的哪个函数占据的宽度最大。只要有"平顶"(plateaus),就表示该函数可能存在性能问题。
Recommend
About Joyk
Aggregate valuable and interesting links.
Joyk means Joy of geeK