

An overview of Application Monitoring with vRealize Operations
source link: https://blogs.vmware.com/management/2020/12/an-overview-of-application-monitoring-with-vrealize-operations.html
Go to the source link to view the article. You can view the picture content, updated content and better typesetting reading experience. If the link is broken, please click the button below to view the snapshot at that time.
An overview of Application Monitoring with vRealize Operations
Matt Bradford posted Yesterday
vRealize Operations brings many capabilities to monitor and manage your private, hybrid, and public clouds. But there’s so much more than just infrastructure management. We also offer several approaches to discovering and monitoring your business applications. There’s service discovery, agent-based application monitoring, and third-party integrations with existing application performance management (APM) systems, plus a few more we’ll discuss below. To help you decide which option is right for you, let’s look at each.
Service Discovery
Available in vRealize Operations Advanced, Enterprise, and Cloud.
Service discovery is exactly what it sounds like and then some. This agentless discovery leverages VMware tools to discover 39 known services plus you can define your own services for discovery.

Service discovery is a good way to kick the tires when it comes to application monitoring and can be useful in a few ways. The first and perhaps most obvious is troubleshooting. Service discovery can provide better context as to the role of a given virtual machine. This is especially useful if your organization uses obfuscated VM names rather than descriptive ones such as Apache01. However, even descriptive names don’t necessarily represent all the services running on a VM. As you can see in the screenshot above, vRealize Operations will show discovered services as child objects of the VM so you have a better idea of what’s running on it.
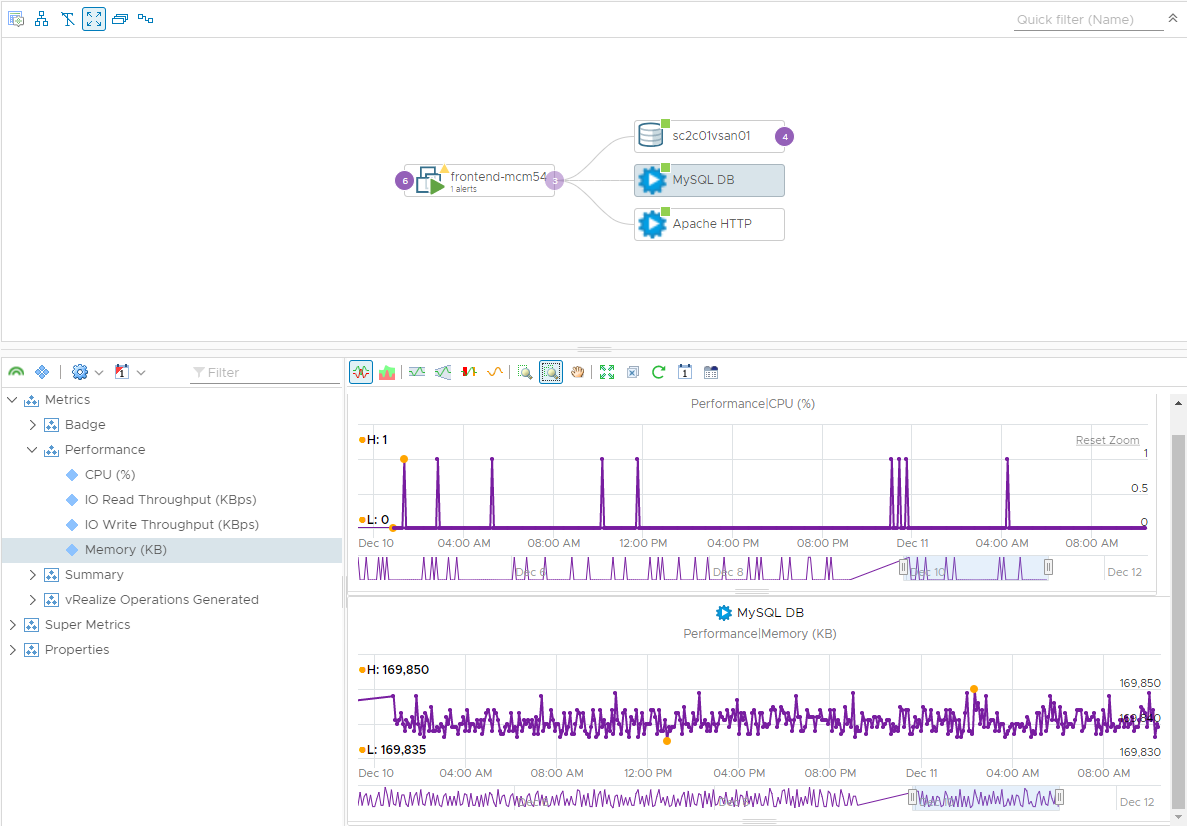
vRealize Operations can also provide some basic information about the CPU, Memory, and I/O being consumed by the service. In addition, you can see the number of connections, version information, install location, and ports used by the service.

Service discovery can also be useful for project planning. For example, you could create reports like the one shown above and use it for migration planning or even identifying VM’s that are running vulnerable versions of services.

Service Discovery also includes a few other tricks that can be useful for troubleshooting. Let’s say you are troubleshooting a VM that is running out of CPU or Memory. Service Discovery can display the top 1-100 processes running on that VM so you can easily see what’s consuming resources without having to leave vROps.

You can also execute commands or run scripts directly from vRealize Operations. Giving you the power to gather more information or even resolve issues without having to open an SSH or RDP session. These features can also be protected via Role-Based Access Control.
Not only is Service Discovery agentless, but you also have the choice of using credentials or leveraging credential-less service discovery. Credential-less is especially useful for environments with frequently rotating passwords. This is done securely by utilizing the service discovery plugin for VMtools and credentials are still required for Top-N and script execution features. You can read more about credential-less service discovery here.
Application monitoring with the Telegraf Agent
Available in vRealize Operations Enterprise and Cloud.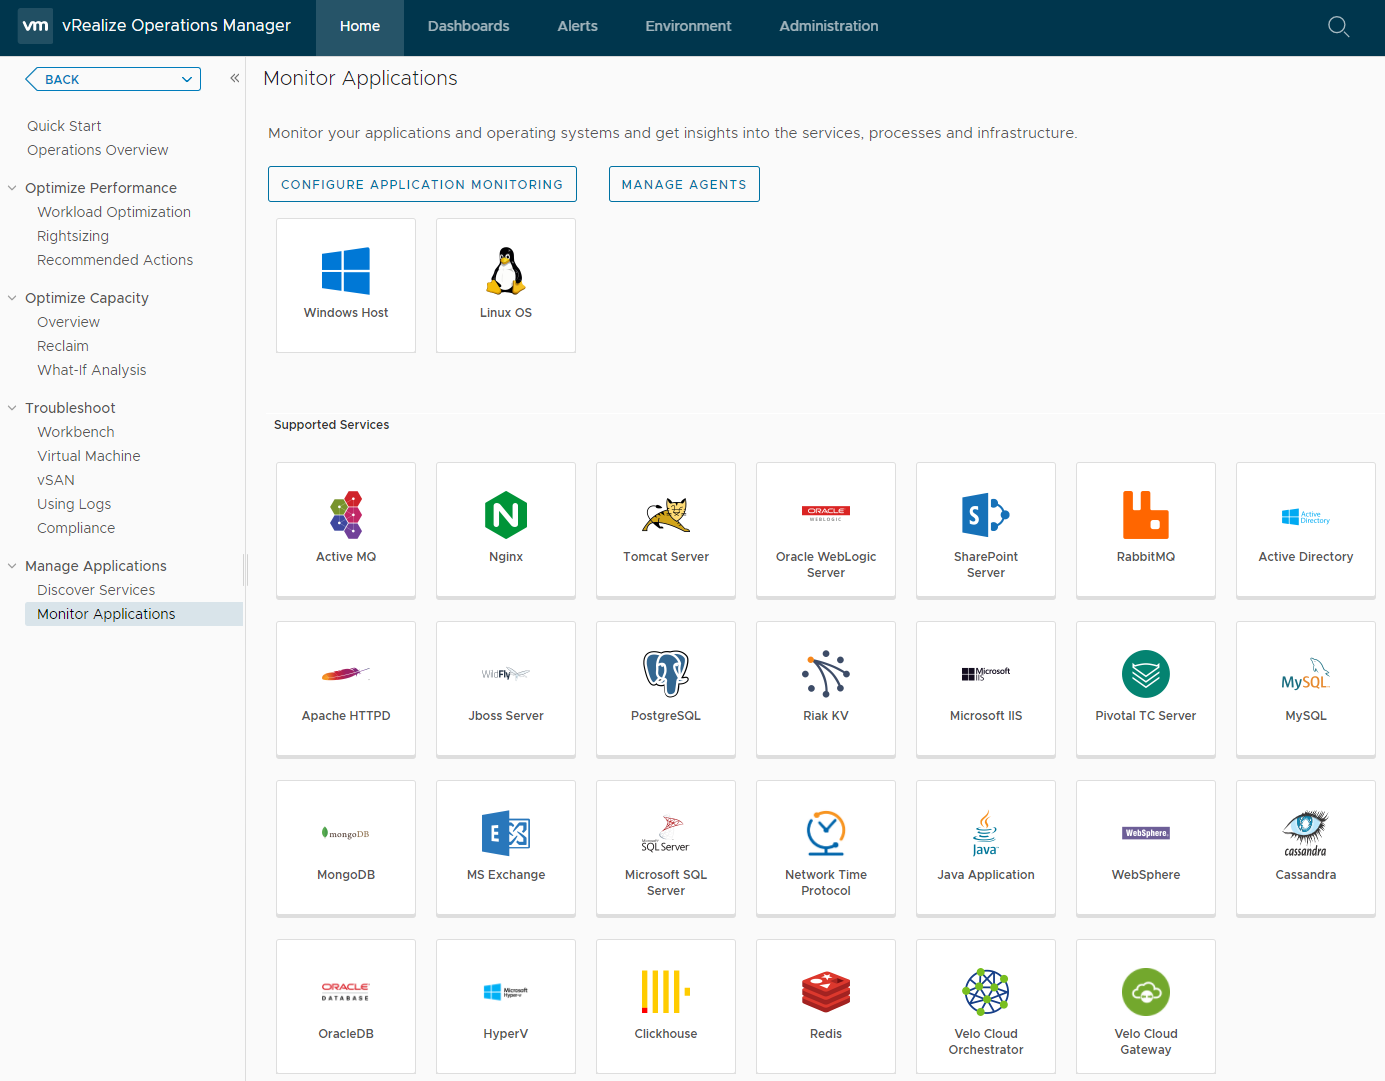
Service Discovery is just the tip of the iceberg when it comes to collecting information on the performance and behavior of your applications. If you’re looking to check under the hood and get better insights into your applications, then vRealize Operations’ agent-based application monitoring is the way to go. Not only will you get more detailed analytics for your applications, but you’ll also get better visibility into the OSes that they’re running on. And unlike Service Discovery that leverages VMware Tools, the Telegraf agent can be installed on Physical and Virtual Machines alike.

Nearly 30 applications can be monitored right out of the box including popular databases such as Microsoft SQL, MySQL, and Oracle Database, web services such as Apache and IIS, plus Active Directory, Microsoft Exchange, SharePoint, and more. There are dozens of metrics available for each application allowing you to further pinpoint any issues including the use of metric correlation and the troubleshooting workbench. You can also be more proactive and leverage alerts to let you know when your SQL logs are starting to fill up their volume for example.


Beyond providing better metrics, the Telegraf agent allows you to collect your own metrics through custom script monitoring. Your script will run every collection cycle and as long as it returns an integer value, it will be collected and can be used just like any other metric in dashboards, alerts, reports, metric correlation, or in the troubleshooting workbench. The possibilities for this reach far and wide. Whether you want to count the number of log files in a folder, the number of times a process has run, or collect status codes from an application, custom script monitoring can collect whatever you like on Windows or Linux systems.

In addition to applications, OSes, and custom scripts you can also leverage the Telegraf agent for other things like checking on HTTP services, ICMP, UDP, and TCP checks.
That’s a quick look at what’s available out of the box. Now, let’s touch on some of the ways you can keep an eye on your applications with add-ons.
vRealize True Visibility Suite
Add on suite for vRealize Operations Advanced, Enterprise, and Cloud.
If you want to go deep into the inner workings of your applications and fine-tune their inner-workings, then the vRealize True Visibility Suite is the way to go. This goes beyond traditional IT provider tools for popular database platforms and applications. For example, Microsoft SQL, MySQL, Oracle Database, Apache Tomcat, Microsoft IIS, SAP, Apache Hadoop, and more.

The vRealize True Visibility Suite will allow you to drill down to specific SQL Queries and identify which ones could be causing performance problems or those that have a high failure rate for example. You’ll basically be able to debug applications right alongside your DBA’s. How cool is that?
And it’s not just applications that the True Visibility Suite can unlock for you. It can also monitor your storage arrays, network hardware, compute hardware and blade chassis, and a whole lot more. Check out the vRealize True Visibility Suite product page to get a hands-on tour or for a trial to run in your own environment.
Application Performance Management Integrations
Available in vRealize Operations Cloud
vRealize Operations Cloud can also integrate with your existing Application Performance Management (APM) systems. We offer integrations with App Dynamics, DataDog, Dynatrace, and New Relic. These tools are generally used by application teams to give them insights into the performance of an application and the overall user experience.

By leveraging existing APM tools you can reduce your agent footprint plus be able to see exactly what your application teams are seeing. This means faster triaging by cutting down on the back-and-forth between teams.

What’s great about these integrations is that vRealize Operations will map the relationship between the Virtual Machine and the applications coming from your APM tools. This way you can trace issues from the infrastructure to the application within one tool. For example, you can leverage vRealize Operations’ powerful Troubleshooting Workbench to identify events, changes, and anomalies across both constructs. And perhaps best of all you don’t need to learn how to use yet another tool. You can access APM data through the familiar vRealize Operations Cloud Interface.
Conclusion
As you can see, vRealize Operations is full of options for application monitoring. Whether you just want to kick the tires, pop the hood to see how things are running, or take it all apart and see how individual components are operating, there’s a solution for everyone. Visit our website for more information or to try vRealize Operations and vRealize Operations Cloud out for yourself.
Recommend
About Joyk
Aggregate valuable and interesting links.
Joyk means Joy of geeK