

Building End-to-End Diagnostics and Tracing: An Intro
source link: https://jimmybogard.com/building-end-to-end-diagnostics-and-tracing-a-primer/
Go to the source link to view the article. You can view the picture content, updated content and better typesetting reading experience. If the link is broken, please click the button below to view the snapshot at that time.
Building End-to-End Diagnostics and Tracing: An Intro
Jimmy Bogard
Posts in this series:
As microservices introduced (forced) highly complex distributed systems into organizations, the tools required to operate these architectures needed to evolve as well. What was a simple stack trace in a single in-process monolith became a web of network calls.
In my first large-scale distributed system, well before the term "microservice" was coined, we hit the problem of operating complex distributed systems almost the second the entire system was turned on. When something went wrong, it could take hours to track down the issue. My old talk on Avoiding Microservices Megadisasters goes into one of these stories - that it took 2 weeks just to figure out how a request was stitched together.
Since then, diagnostics and tracing have come a long way. In this series, I want to walk through adding diagnostics and tracing to a library I've used quite a lot over the years - NServiceBus. Based on those techniques, we can add diagnostics and tracing to any network-communicating library or component.
The Overall Problem
In a single in-process application, when something goes wrong, you have a stack trace telling you exactly where in the system an exception occurred. But if you've got distributed systems communication with each other, it's not enough to have a stack trace of a single application. Often, we need to understand causality all the way back out to the original external trigger or event that led to a fault.
The solution to this problem is "distributed tracing". Instead of having a single call stack, we connect multiple call stacks together by introducing some additional tracing metadata between each node.
Over the years, many tools and products arose to fill this niche. I've used a few, and built a few, but with each new tool rose a new means to plug it in.
If I wanted to use Dynatrace, I needed to have Dynatrace plugins to everything I used. If I wanted to use Zipkin, the same. And if those plugins didn't exist for whatever library I was using, I needed to build that myself. Each tool had its own way of providing its tracing context. Zipkin has its own, and NServiceBus has its own, and some don't have anything.
This is where standards come in - to provide a common way of:
- Identifying and propagating tracing information
- Raising diagnostic event notifications
- Reporting diagnostic telemetry information
NServiceBus has a very robust distributed tracing mechanism and reporting tool with ServiceInsight, however, similar to Zipkin/Jaeger/Prometheus etc., it's using proprietary means of doing so and doesn't directly plug in to any other reporting tool or network communication.
The Plan
In order to make any new network component "play nice" with distributed tracing, a few things need to happen:
- All incoming network traffic needs to capture tracing information
- All outgoing network traffic needs to propagate tracing information
- Any interesting diagnostic event needs to be emitted
- Diagnostic events raised need to be captured and re-emitted as telemetry
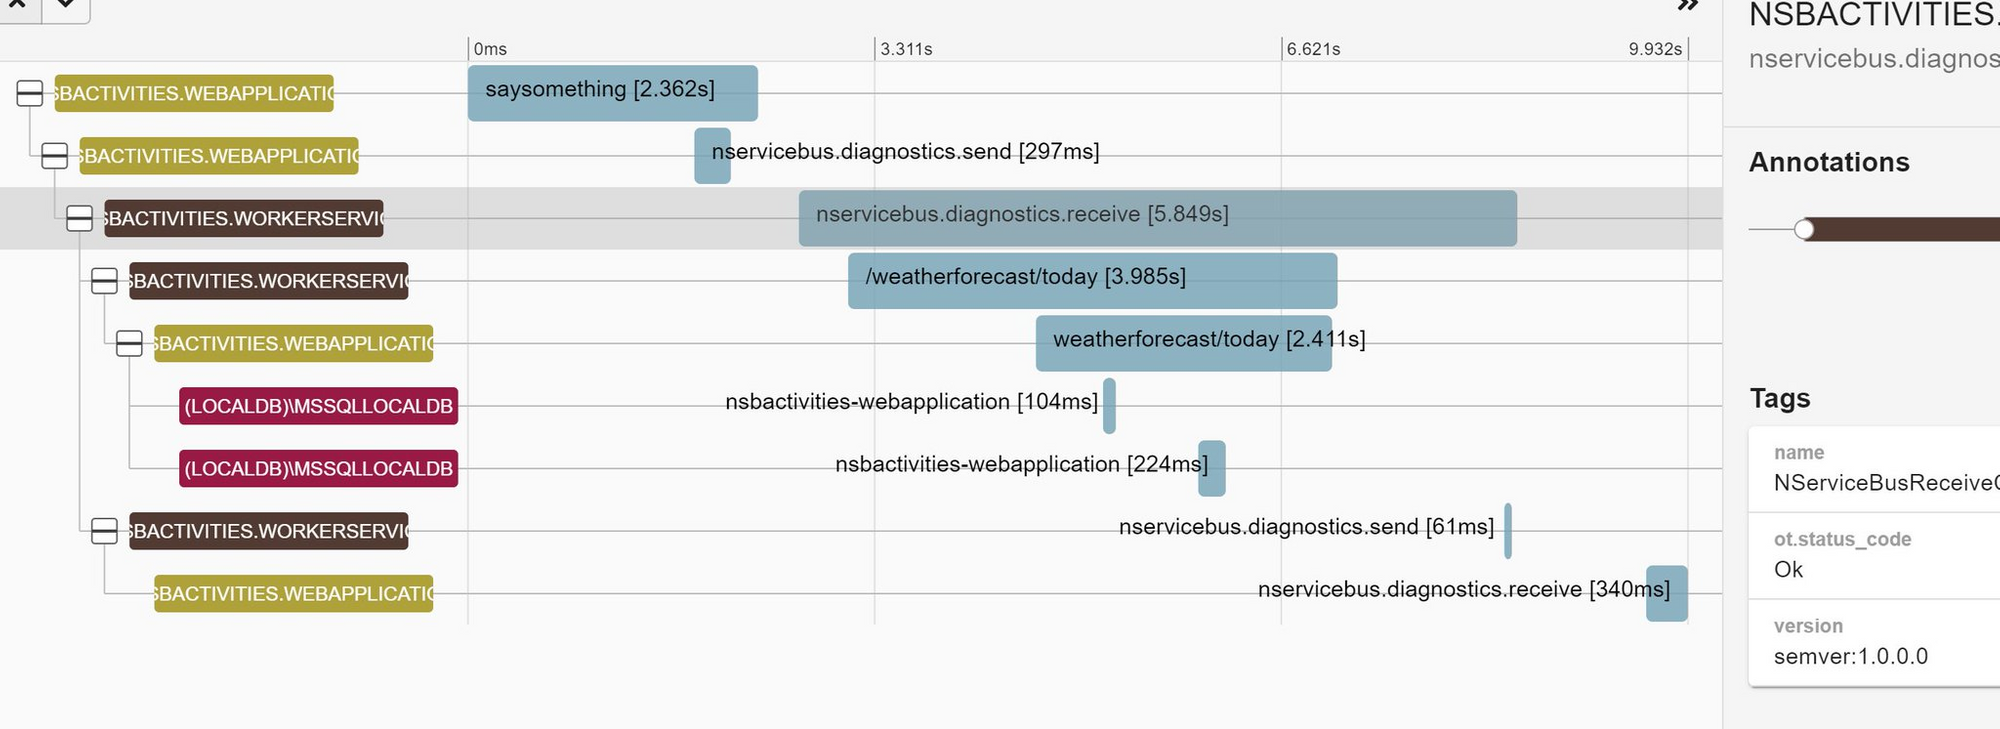
In this series, I'll walk through each of these steps, the standards applied, and middleware needed to connect all the pieces together. In the end, we'll have a complete picture of a distributed system that uses ASP.NET Core, HttpClient, and RabbitMQ, and SQL together in a single picture:
Recommend
-
8
Microservices Building End-to-End Diagnostics: ActivitySource and OpenTelemetry 1.0
-
3
I’ve gotten a lot of questions about continuous production profiling lately. Why would anyone want to profile in production, or, if production profiling seems reasonable, why the heck leave it on continuously? I thought I’d take a few moments...
-
8
Microservices Building End-to-End Diagnostics: User-Defined Context with Correlation Context
-
6
Distributed Systems Diagnostics and Instrumentation Packages for MongoDB and NServiceBus Published ...
-
4
Microservices Building End-to-End Diagnostics: Visualization with Exporters
-
9
Microservices Building End-to-End Diagnostics: Activity and Span Correlation
-
7
Microservices Building End-to-End Diagnostics: OpenTelemetry Integration
-
7
Microservices Building End-to-End Diagnostics and Tracing: Diagnostic Events
-
8
Microservices Building End-to-End Diagnostics and Tracing: Trace Context
-
1
Distributed Systems Building NServiceBus Metrics with OpenTelemetry and System.Diagnostics.Metrics
About Joyk
Aggregate valuable and interesting links.
Joyk means Joy of geeK