

WinUI UI Controls | Progress Telerik UI for WinUI
source link: https://www.telerik.com/winui
Go to the source link to view the article. You can view the picture content, updated content and better typesetting reading experience. If the link is broken, please click the button below to view the snapshot at that time.

What is WinUI
WinUI is the latest Microsoft UI framework for building Windows apps across both Win32 and UWP. As the native UI layer in Windows, it embodies Fluent Design, hence making it the most modern UI framework for building desktop applications in Windows.
Microsoft released a WinUI 3.0 preview and is committed to making it the de facto standard for building Windows applications.
WinUI Benefits
- Native Windows UI
- Fluent Design
- Use WinUI controls in Win32 apps such as WinForms, WPF, even MFC
- Create new Windows apps with the desired app model (Win32 or UWP) and language (C# or C++)
Telerik UI for WinUI
Telerik UI for WinUI is an early experiment for the UI component suite, targeting WinUI 3.0. Its purpose is to make the development of modern and feature-rich applications faster and easier.
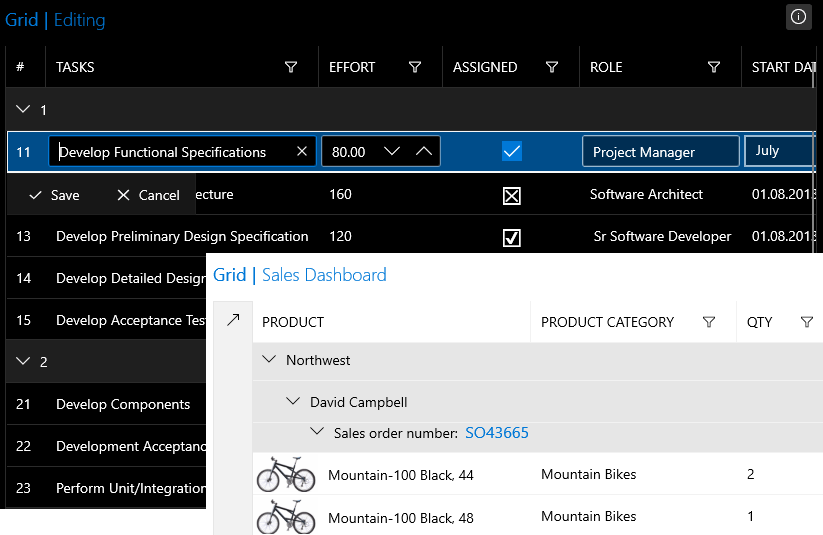
The first version of Telerik UI for WinUI features a powerful DataGrid component. The control ships with the following features:
- UI Virtualization
- DataBinding
- Filtering, Sorting, Grouping
- Aggregates
- Compact (desktop) and standard (tablet) layouts
- Row Details
- Row Aggregates
- Row and Cell Selection
- Editing
- Validation
- Localization
- Commands
WinUI New Control: Charts
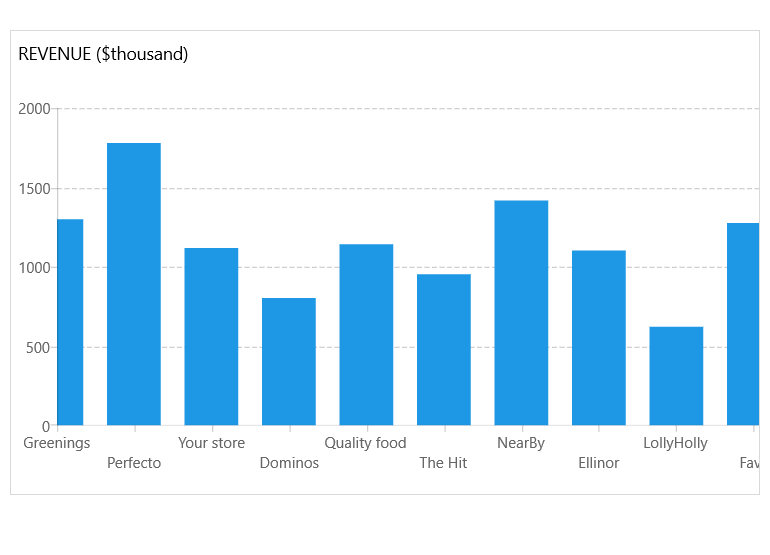
The Telerik UI for WinUI Charts features a large collection of chart and graph types and series that allow you to visualize data according to your data visualization application requirements. You can benefit from a wide range of chart and graph types, unmatched performance regarding loading time, drawing capabilities, and real-time updates.
The Chart types are organized in hierarchies, depending on the coordinate system, used to plot data points, for example:
- RadCartesianChart: uses the Cartesian coordinate system, and includes axes and series. The Cartesian includes the following axes and series:
- Cartesian axes: Categorical, Date-time Categorical, Linear, Logarithmic, Date-Time Continuous, DateTime on the timeline
- Cartesian series: Bar, Spline, Area, SplineArea, Candlestick, OHLC (a special financial series for stock trends)
- RadPolarChart: uses the radial coordinate system, and includes the following axes and series:
- PolarChart axes: CategoricalRadial, NumericalRadialAxis, Polar, and a special numerical axis that calculates the radius value of each data point.
- PolarChart series: PolarPoint, PolarLine, PolarSpline, PolarArea, PolarSplineArea
- RadPieChart: uses pie slices for proportional data visualization
WinUI New Control: Gauges
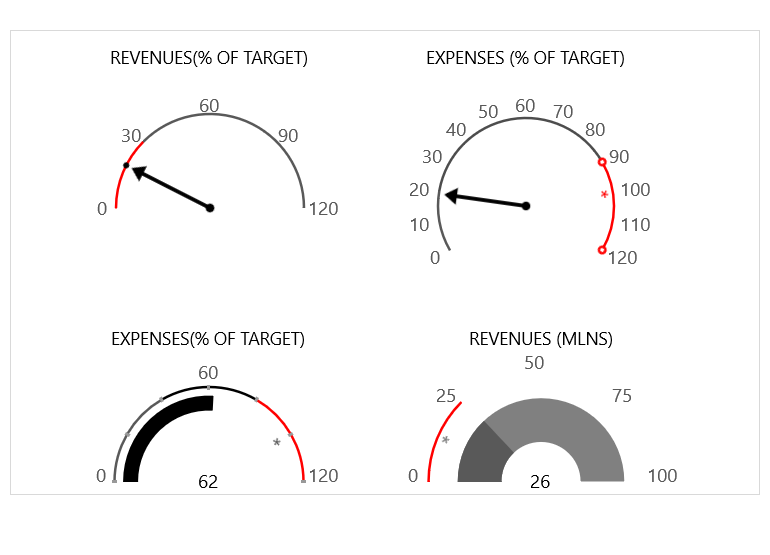
The Telerik UI for WInUI Gauges widget is one of the most valuable controls for data visualization. If offers highly customizable, animated and user-friendly linear and radial gauges, all configurable to display your data in the exact required layout. The Gauges are a great way to illustrate the magnitude of a value in a given range of upper and lower bounds. This could be speed, distance, temperature, or progress of a process.
Here’s what’s included:
- Radial Gauge: Radial Gauge is a circular scale with numbers and ticks. It can display multiple scales and ranges.
- Linear Gauge: Linear Gauge is a linear scale, which can display multiple scales and ranges.
- Indicators: RadGauge for WinUI offers a large set of indicators suitable for many scenarios.
- Rich Customization Capabilities: The gauges are extremely customizable with a variety of built-in behaviors starting from scales, indicators, labels, ticks etc.
- Animations: All gauges support animation out of the box.
WinUI New Control: BulletGraph
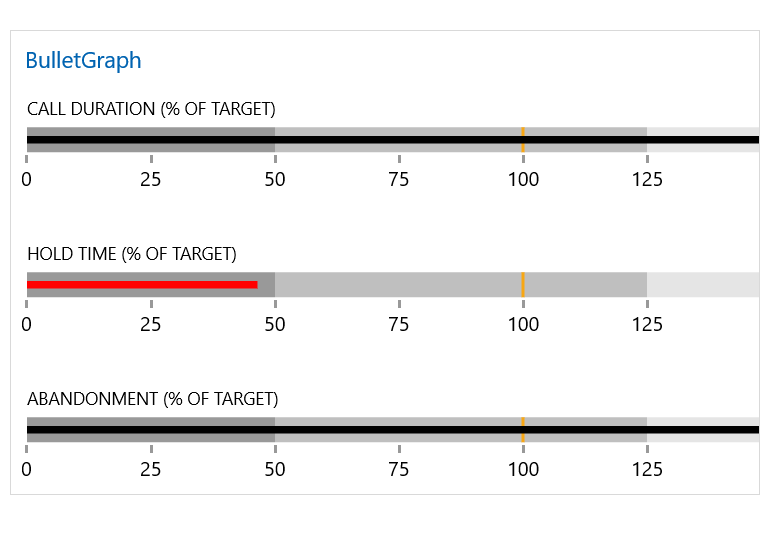
The TelerikBulletGraph for WinUI is a variation of a linear gauge and combines a number of indicators, as well as a data indicator into one control. The BulletGraph UI control is lightweight, easily customizable, and straightforward to set up and use. If you are looking to experiment in creating information-heavy dashboards in a relatively small size, you’d find this control indispensable!
Here are some of the key features:
- Featured Measure: Display a Featured Measure to indicate some progress.
- Comparative Measure: The Comparative Measure allows for indicating a certain threshold.
- Ticks and Lables: Customizable Ticks and Labels.
- Data binding support: Easily bind RadBulletGraph for WinUI to your business data, either by setting its properties directly or by using a binding declaration.
- Styling and appearance: The Telerik RadBulletGraph is a fully customizable control, giving you ultimate flexibility for look and feel.
Experiment With Us
Delivering stellar products can only happen with your help. We invite you to become a collaborator - share your feedback and help us shape the future of Telerik UI for WinUI. Suggest or recommend anything you’re missing and we’ll use your input to add amazing new components and APIs to the roadmap.
During the experimental phase, Telerik UI for WinUI will be a free trial, and we hope you will continue sharing your use cases, experience and roadblocks with us.
Recommend
About Joyk
Aggregate valuable and interesting links.
Joyk means Joy of geeK