
Edit and Replay your network requests, direct from the browser
source link: https://jonhilton.net/debuggable-network-requests/
Go to the source link to view the article. You can view the picture content, updated content and better typesetting reading experience. If the link is broken, please click the button below to view the snapshot at that time.

Edit and Replay your network requests, direct from the browser
You know how it goes; you build your shiny new feature using Blazor, React, Vue, <insert framework here>.
You test locally; everything works as it should.
Then you push to production and…
… everything is broken!
Any number of things can break your app in prod but one of the biggies is data coming back (or being posted) via your network calls which doesn’t match what you expected.
For some time we’ve been able to inspect those network requests via the browser’s Dev Tools, to see what’s really going on.

You can inspect the request, check what parameters are being sent across, then look at the response and inspect the resulting data to see why your feature might be working the way it is.
But, what if you want to play with that request, tweak it’s parameters, or just replay the request, without having to drive everything from the UI?
Microsoft Edge now includes an Edit and Replay feature comes in, and it’s pretty darn useful.
Considering Blazor for your next project?
Learn my simple, repeatable process for transforming ideas into features using Blazor's component model.
4 days, 4 emails; enter your email in the box below and I'll send you Lesson #1.
So long as you’re using the new (actually really good) Chromium version of Edge, you can enable the shiny new Network Console for your browser.
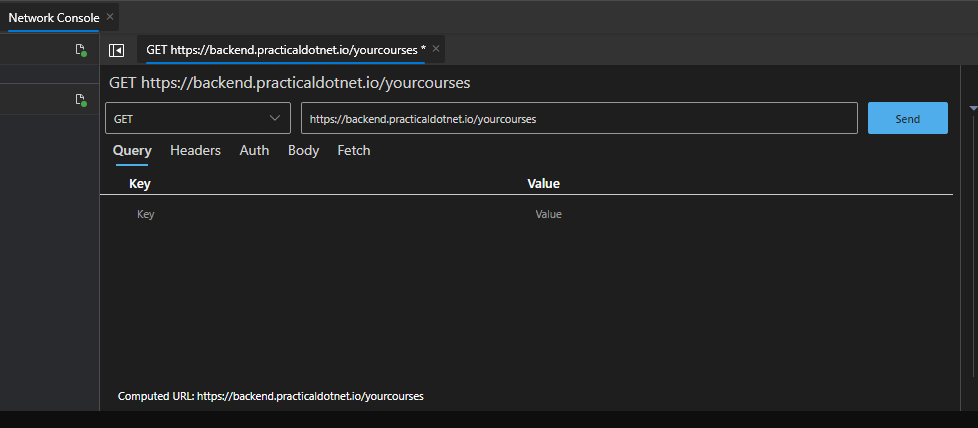
With that, head over to any network request in the Dev Tools, right-click and select Edit and Replay and…

The Network Console springs into life and shows you the request, including things like Query parameters, the request Body and Auth tokens etc.
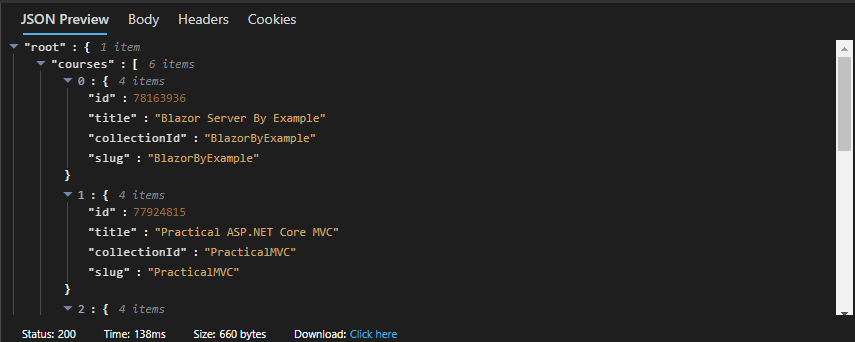
From here you can click Send to replay the request, at which point you can easily inspect the response for that request…

Then you can download the resulting json, or just edit the request and try again.
There are of course other ways to achieve similar results. I’ve been a big fan of a tool called Insomnia in recent years.
But, for testing authenticated requests it was always a bit of a pain to locate the JWT auth token, copy it and paste it across to Insomnia, then set up the request etc.
Now, with a couple of clicks you can replay requests right there in the browser, Auth tokens and everything!
It’s worth noting this is an “Experimental Feature so expect a few bugs here and there, but overall this looks like a big step forward for testing your client applications.
Check out this post by Microsoft for all the details (including how to enable this in Edge).
Considering Blazor for your next project?
Learn my simple, repeatable process for transforming ideas into features using Blazor's component model.
4 days, 4 emails; enter your email in the box below and I'll send you Lesson #1.
Next up
Dark mode for your web applications (using Blazor and Tailwind CSS)Recommend
About Joyk
Aggregate valuable and interesting links.
Joyk means Joy of geeK