

Afficher des pictogrammes avec polymaps
source link: https://blog.mathieu-leplatre.info/afficher-des-pictogrammes-avec-polymaps-fr.html
Go to the source link to view the article. You can view the picture content, updated content and better typesetting reading experience. If the link is broken, please click the button below to view the snapshot at that time.

Afficher des pictogrammes avec polymaps
Mon 28 February 2011En reprenant l'exemple de l'épisode précédent avec polymaps, nous allons maintenant afficher des pictogrammes sur les points.
On conserve la couche GeoJSON en utilisant un callback pour l'évènement load.
map.add(po.geoJson()
          .url('collecteurs.json')
          .on("load", load));
Dans la fonction load(), nous allons remplacer les cercles dessinés par défaut par des pictogrammes en manipulant les éléments de la page (DOM). Nous utilisons ici la variable n$, qui provient du miniscript nns.js livré dans l'archive polymaps et qui facilite la manipulation du DOM (le vénérable jquery ferait aussi l'affaire)
function load(e) {
    var ICONSIZE = 16;
    // Parcourir les features de la carte
    for (var i = 0; i < e.features.length; i++) {
        var circle = n$(e.features[i].element);
        var root = circle.parent();
        var attributes = e.features[i].data.properties;

        // Ajouter et positionner le pictogramme
        // (à partir de la position du cercle)
        img = root.add("svg:image")
             .attr('width', ICONSIZE)
             .attr('height', ICONSIZE)
             .attr("transform", circle.attr('transform')
                            + ' translate(-'+(ICONSIZE/2)+','
                                       + '-'+(ICONSIZE/2)+')');
        // Enlever le cercle original
        root.remove(circle);
        // Définir le chemin du pictogramme à utiliser
        // en fonction de l'attribut
        img.attr('xlink:href', attributes.Etat == 'Actif' ?
                               'actif.svg' : 'inactif.svg');
    }
}
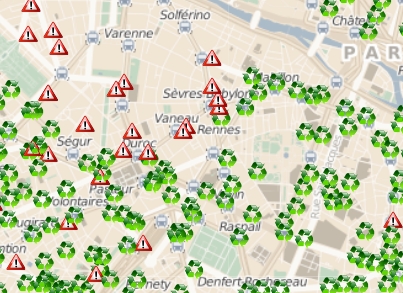
© City of Paris, ODBL, CloudMade, OpenStreetMap contributors, CCBYSA
Ici, nous avons utilisé des pictogrammes SVG, mais le même code fonctionne avec des /images PNG ou JPG...
#javascript, #polymaps, #gis - Posted in the Dev category
© Copyright 2020 by Mathieu Leplatre. mnmlist Theme
Content licensed under the Creative Commons attribution-noncommercial-sharealike License.
Recommend
About Joyk
Aggregate valuable and interesting links.
Joyk means Joy of geeK