
A C++ API for Vega-Lite
source link: https://blog.jupyter.org/a-c-backend-for-vega-lite-bd2524b247c2
Go to the source link to view the article. You can view the picture content, updated content and better typesetting reading experience. If the link is broken, please click the button below to view the snapshot at that time.

A C++ API for Vega-Lite
In this post, we present the first public release of XVega, a C++ library for producing Vega-Lite charts.
Data science workflows differ from traditional software development in that engineers make use of available tools to explore and reason about a problem. In such exploratory work, engineers load data, crunch numbers, produce simple visualizations and iterate… Progress happens in quick incremental iterations, which is possible when tooling does not get in the way.
This kind of interactive computing is generally associated with the Python or R programming languages. However, with the advent of the Cling C++ interpreter from CERN, and the subsequent development of the xeus-cling Jupyter kernel, new possibilities have opened up in this space.
The Jupyter stack — that started in the scientific Python community has evolved into a language-agnostic framework that can now be leveraged by C++ developers. It bridges the gap between the countless scientific computing libraries and tools available in C++ and the Jupyter ecosystem.
The scientific C++ stack now has numerous projects under its belt — such as xtensor, xframe, etc. However, there is little support for visualization — especially for interactive plots. While there exist matplotlib-cpp and matplotplusplus (with their plotting API resembling the original matplotlib library) — they suffer from the same cons as the original library does (such as the imperative API and the confusion between dual object-oriented and state-based interface).
Owing to all these shortcomings, along with the observation that JupyterLab comes with existing support for Vega and Vega-Lite Charts (through the application/vnd.vegalite.v3+json MIME type), one can leverage this support to bridge the gap rather than reinvent the wheel. Apart from standalone use — one could also integrate such a system into other projects such as xeus-SQLite.
The main idea is to programmatically fill in a JSON that conforms to the Vega-Lite specification and respects the notion of grammar of graphics. It is analogous to what Altair did for Python. We will expose different APIs responsible for filling in certain parts of the JSON.
The fundamentals with XVega are still the same, i.e. the three essential elements of a Chart are Data, Marks and Encodings as usual and importing the library is as simple as writing two statements:
#include "xvega/xvega.hpp"using namespace xv;
The experience is similar to what Altair offers and, hence, the central piece to the library is the Chart() object — which knows how to emit the JSON dictionary representing the data and visualization encodings.
For those unfamiliar with the Vega ecosystem, a quick recap for the above terms is given below:
- Marks — What graphic should represent the data?
- Encodings — Mapping between Data and Visual Elements of the Chart (such as x-axis, etc.).
- Encoding Types: Quantitative (real-valued), Nominal (unordered categorical), Ordinal (ordered categorical), Temporal (time-series).

The core strength of using such a system is the separation of specification and execution. The declarative API makes it easy to specify “what” should be done rather than focus on incidental details of the “how”. It means that rather than having a special “hist()” function for plotting a histogram, passing “bin=True” does the job.

We can of-course customize the binning parameters with a “Bin()” object instead. And while we are doing that, let’s add a colour encoding as well to get a sense of the 3rd dimension.

Another plus of using Vega-Lite is the possibility of using transformations within the specification rather than doing it before.
(E.g., one can do linear regression as a part of this declarative API).

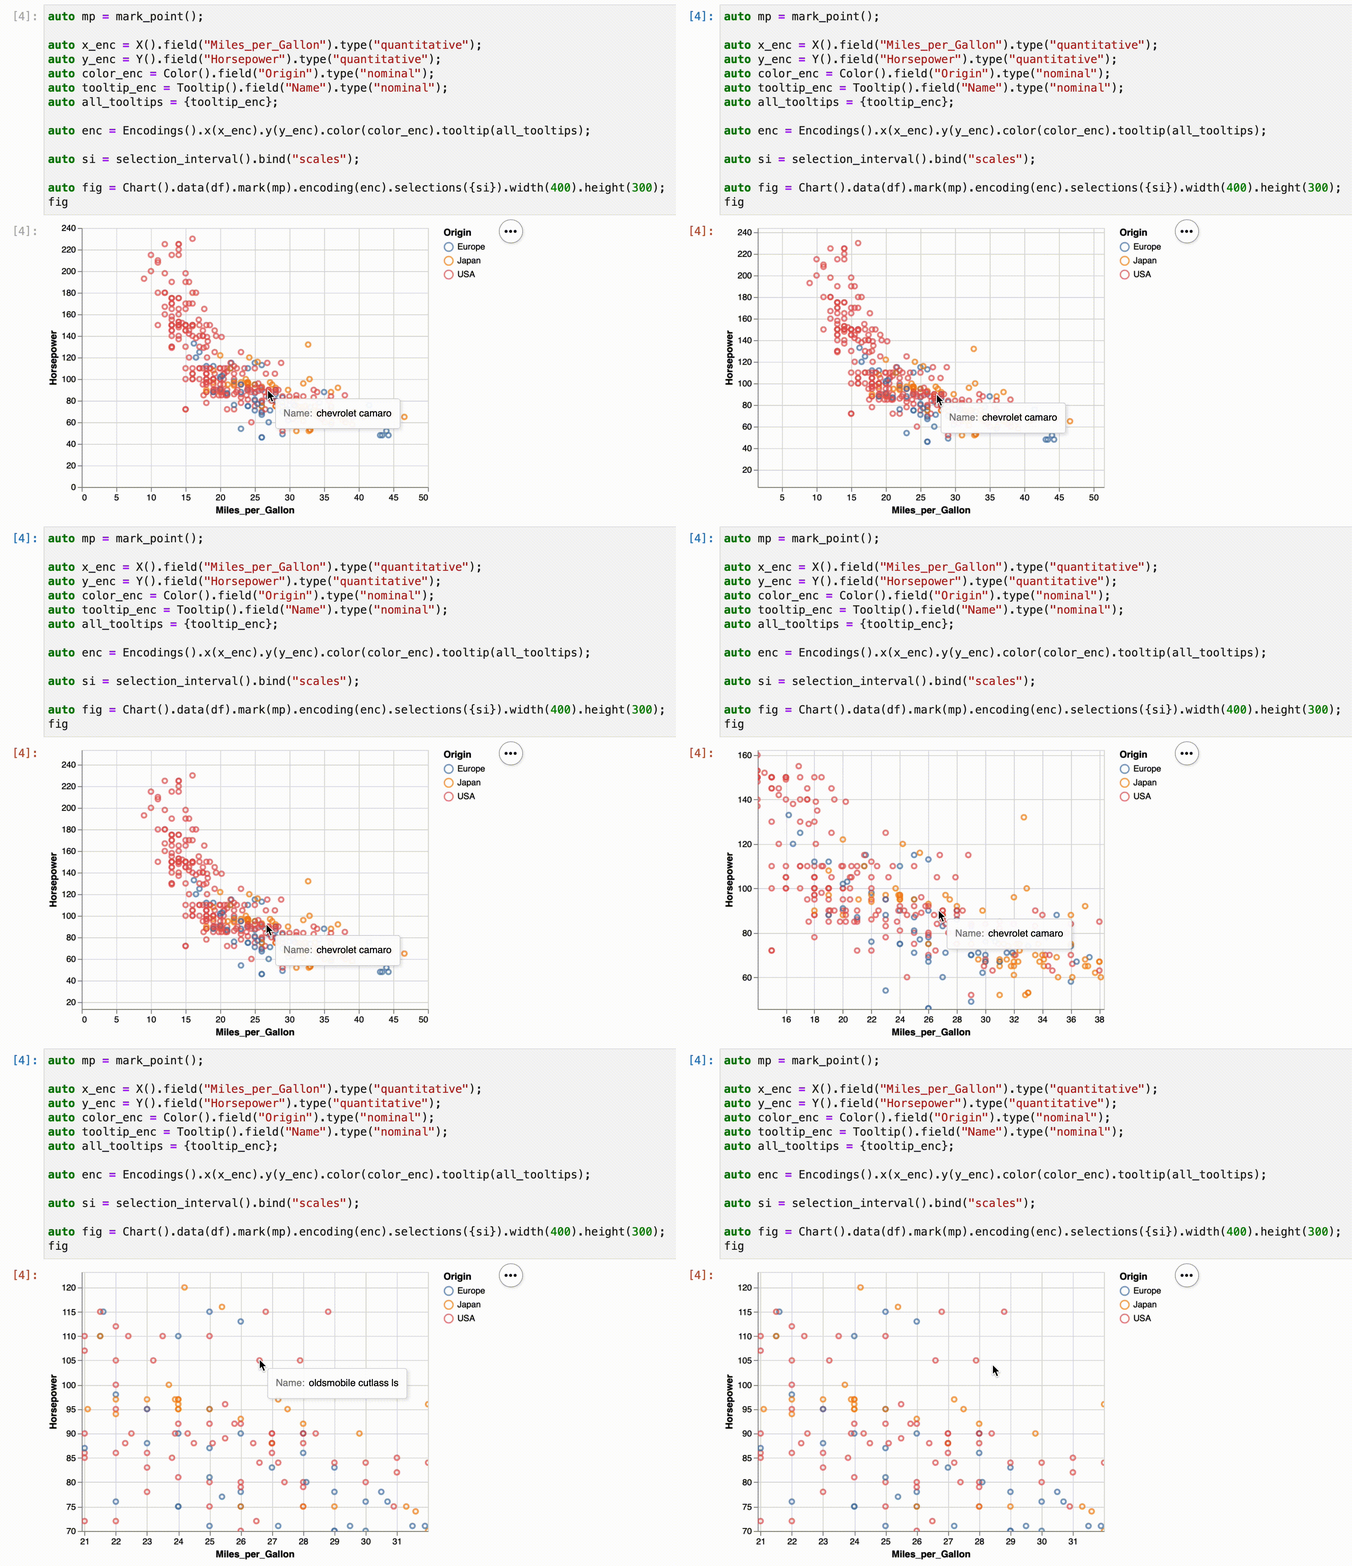
Lastly, support for Interactions and Selections is a no-brainer. It’s as simple as defining what to use and adding it to the Chart() object.

Recommend
About Joyk
Aggregate valuable and interesting links.
Joyk means Joy of geeK