

日志分析平台ELK之日志收集器filebeat
source link: http://www.cnblogs.com/qiuhom-1874/p/13767152.html
Go to the source link to view the article. You can view the picture content, updated content and better typesetting reading experience. If the link is broken, please click the button below to view the snapshot at that time.

前面我们了解了elk集群中的logstash的用法,使用logstash处理日志挺好的,但是有一个缺陷,就是太慢了;当然logstash慢的原因是它依赖jruby虚拟机,jruby虚拟机就是用java语言开发的ruby虚拟机,本身java程序运行在jvm上就已经很慢了,而logstash还要运行在用java语言开发的ruby虚拟机上,就相当于虚拟机上跑一个虚拟机,可想而知;如果我们只需要收集和处理日志,在agent端如果运行logstash,显得格外的消耗资源;为了解决这种问题,elastic开发了一款更加轻量级的日志收集器beats;而filebeat只是其中的一种,它是基于收集本地日志文件中的内容,然后输出到某个地方;中间不会对日志做过多的处理;有点类似rsyslog,只做日志转发;如果我们需要对日志做处理,我们可以把filebeat的输出源配置成logstash,让logstash运行在一个独立的服务器上,专门做日志处理;
filebeat收集日志过程
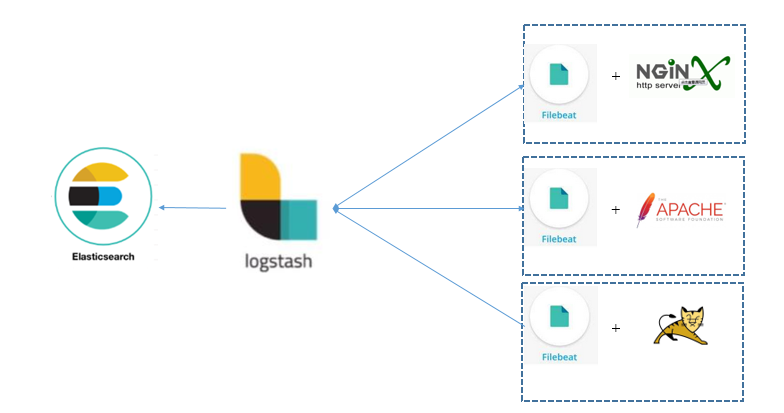
提示:以上是filebeat收集日志,然后把日志转发给logstash进行分析,然后logstash把filebeat发送过来的日志,做切词,分析,处理以后,然后在把日志发送给elasticsearch存储;
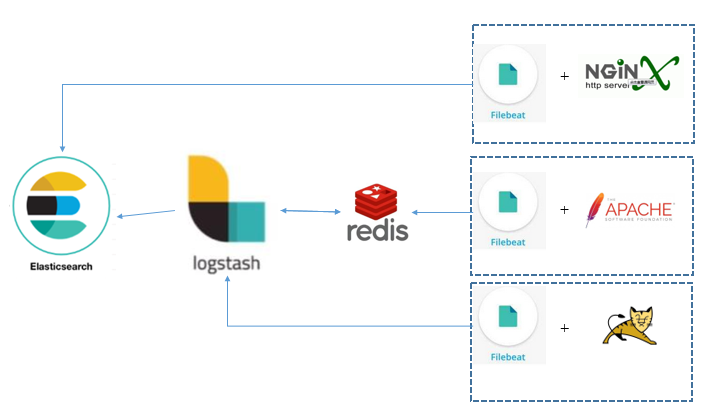
提示:如果后端的filebeat一旦增多,logstash的压力会非常大,为了解决这样的问题,我们可在中间加redis是做临时缓存;然后logstash就到redis里读日志;然后再把读到的日志存储到elasticsearch中;当然filebeat也是可以直接将日志数据发送给elasticsearch进行存储;
filebeat安装
下载同elasticsearch版本的filebeat rpm包
[root@node03 ~]# wget https://artifacts.elastic.co/downloads/beats/filebeat/filebeat-6.8.12-x86_64.rpm
--2020-10-04 14:03:03--  https://artifacts.elastic.co/downloads/beats/filebeat/filebeat-6.8.12-x86_64.rpm
Resolving artifacts.elastic.co (artifacts.elastic.co)... 151.101.230.222, 2a04:4e42:36::734
Connecting to artifacts.elastic.co (artifacts.elastic.co)|151.101.230.222|:443... connected.
HTTP request sent, awaiting response... 200 OK
Length: 11904164 (11M) [application/octet-stream]
Saving to: ‘filebeat-6.8.12-x86_64.rpm’

100%[================================================================================>] 11,904,164  9.76KB/s   in 16m 35s

2020-10-04 14:19:41 (11.7 KB/s) - ‘filebeat-6.8.12-x86_64.rpm’ saved [11904164/11904164]

[root@node03 ~]# ll
total 184540
-rw-r--r-- 1 root root  11904164 Aug 18 19:35 filebeat-6.8.12-x86_64.rpm
-rw-r--r-- 1 root root 177059640 Aug 18 19:41 logstash-6.8.12.rpm
[root@node03 ~]#
安装filebeat-6.8.12.rpm包
[root@node03 ~]# yum install ./filebeat-6.8.12-x86_64.rpm -y
Loaded plugins: fastestmirror
Examining ./filebeat-6.8.12-x86_64.rpm: filebeat-6.8.12-1.x86_64
Marking ./filebeat-6.8.12-x86_64.rpm to be installed
Resolving Dependencies
--> Running transaction check
---> Package filebeat.x86_64 0:6.8.12-1 will be installed
--> Finished Dependency Resolution

Dependencies Resolved

==========================================================================================================================
 Package                  Arch                   Version                    Repository                               Size
==========================================================================================================================
Installing:
 filebeat                 x86_64                 6.8.12-1                   /filebeat-6.8.12-x86_64                  38 M

Transaction Summary
==========================================================================================================================
Install  1 Package

Total size: 38 M
Installed size: 38 M
Downloading packages:
Running transaction check
Running transaction test
Transaction test succeeded
Running transaction
  Installing : filebeat-6.8.12-1.x86_64                                                                               1/1
  Verifying  : filebeat-6.8.12-1.x86_64                                                                               1/1

Installed:
  filebeat.x86_64 0:6.8.12-1

Complete!
[root@node03 ~]#
示例:配置filebeat收集httpd的日志,然后将收集的日志输出到logstash
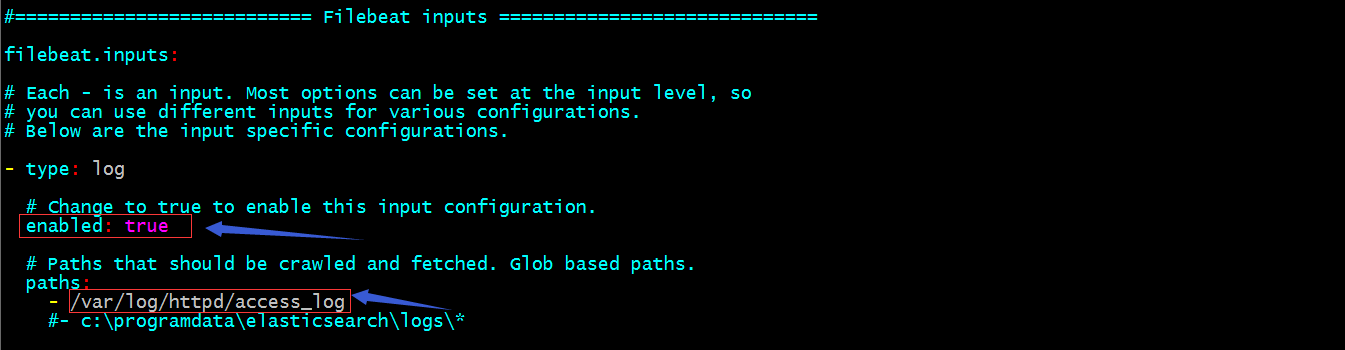
提示:以上配置表示开启filebeat插件收集/var/log/httpd/access_log中的日志;

提示:以上配置表示把filebeat收集的日志发送给node03:5044;
配置node03的logstash输入数据监听5044端口
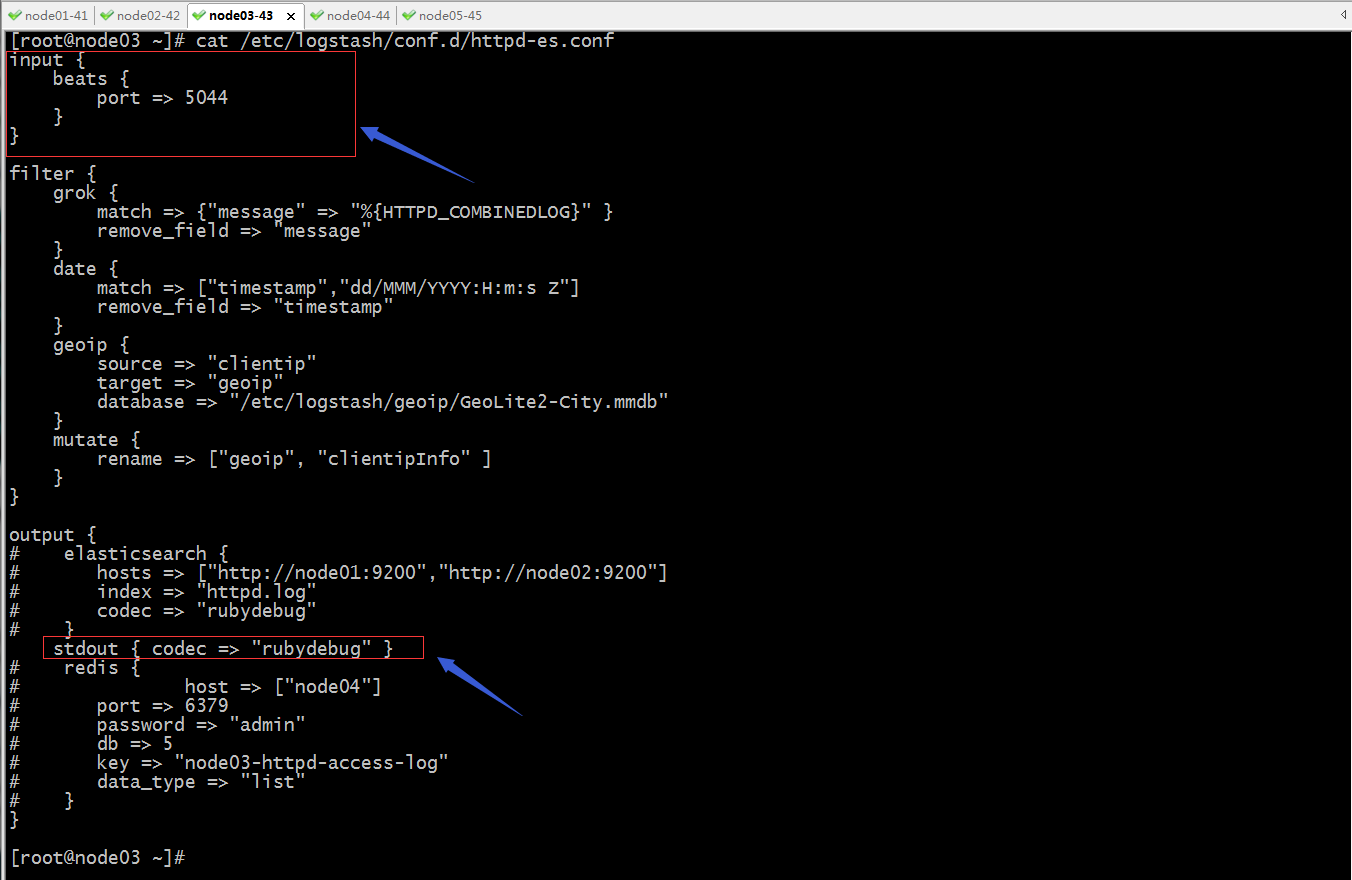
提示:以上配置表示启动logstash中的beats插件作为数据输入,并监听5044端口;然后logstash将处理后端日志数据输出到标准输出;
启动filebeat和logstash
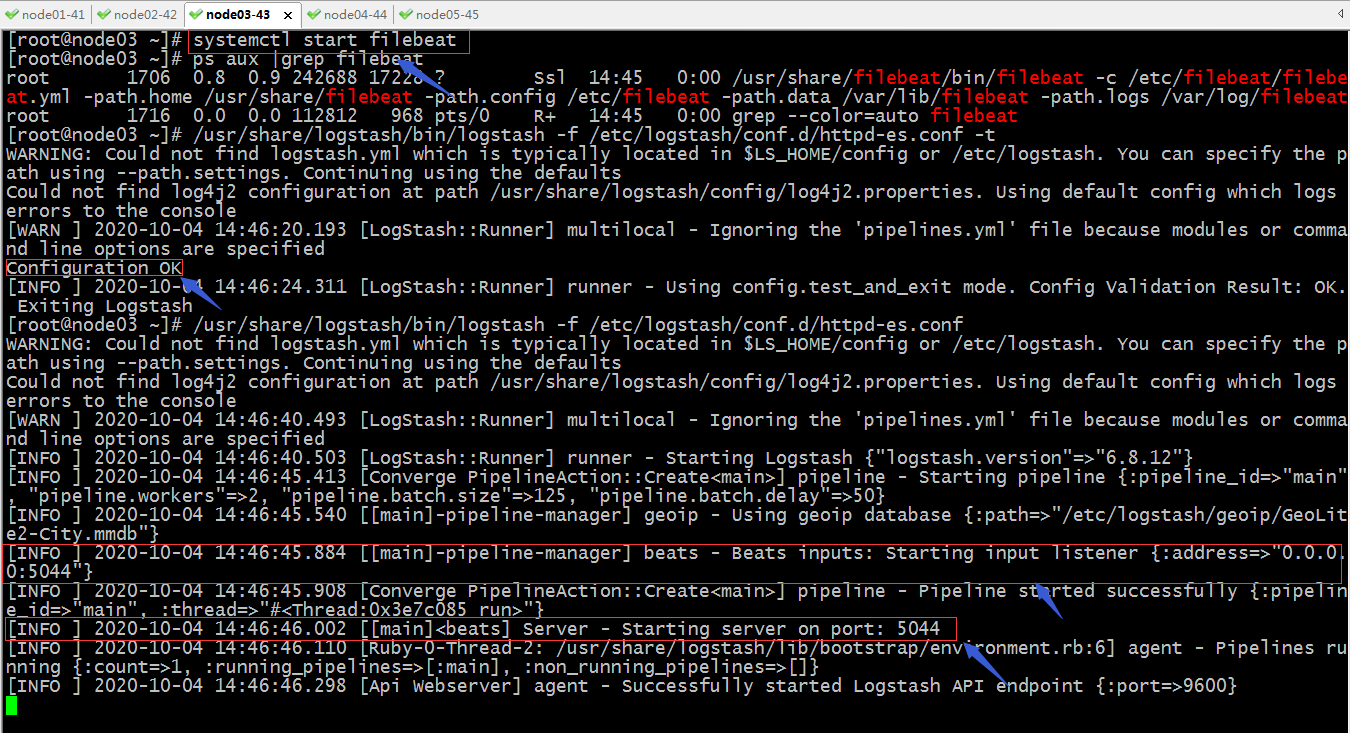
提示:可以看到logstash启动时,它监听5044端口;
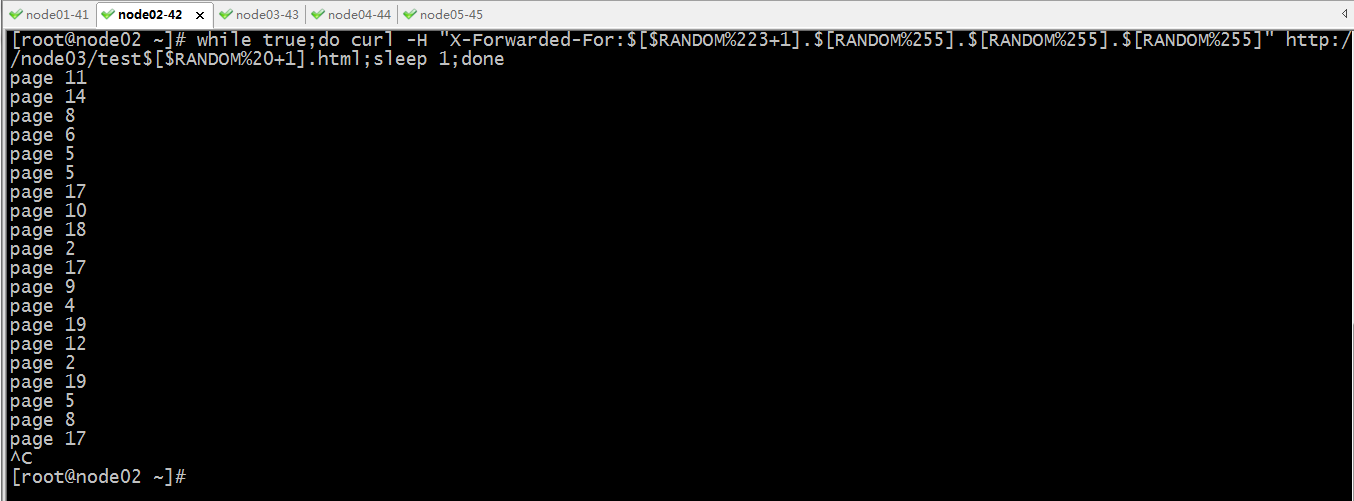
用其他主机模拟互联网用户访问node03的httpd提供的页面
[root@node01 ~]# curl -H "X-Forwarded-For:$[$RANDOM%223+1].$[RANDOM%255].$[RANDOM%255].$[RANDOM%255]" http://node03/test$[$RANDOM%20+1].html
page 18
[root@node01 ~]#
在node03的logstash的标准输出上,看看是否收集到httpd的访问日志?
/usr/share/logstash/vendor/bundle/jruby/2.5.0/gems/awesome_print-1.7.0/lib/awesome_print/formatters/base_formatter.rb:31: warning: constant ::Fixnum is deprecated
{
            "host" => {
                   "os" => {
            "platform" => "centos",
             "version" => "7 (Core)",
              "family" => "redhat",
                "name" => "CentOS Linux",
            "codename" => "Core"
        },
        "containerized" => false,
         "architecture" => "x86_64",
                 "name" => "node03.test.org",
                   "id" => "002f3e572e3e4886ac9e98db8584b467"
    },
      "prospector" => {
        "type" => "log"
    },
            "auth" => "-",
        "clientip" => "25.99.168.124",
           "agent" => "\"curl/7.29.0\"",
            "tags" => [
        [0] "beats_input_codec_plain_applied"
    ],
      "@timestamp" => 2020-10-04T06:49:34.000Z,
        "@version" => "1",
           "bytes" => "8",
          "offset" => 0,
            "verb" => "GET",
        "referrer" => "\"-\"",
          "source" => "/var/log/httpd/access_log",
             "log" => {
        "file" => {
            "path" => "/var/log/httpd/access_log"
        }
    },
    "clientipInfo" => {
        "continent_code" => "EU",
             "longitude" => -0.1224,
         "country_code2" => "GB",
                    "ip" => "25.99.168.124",
          "country_name" => "United Kingdom",
         "country_code3" => "GB",
              "location" => {
            "lat" => 51.4964,
            "lon" => -0.1224
        },
              "timezone" => "Europe/London",
              "latitude" => 51.4964
    },
            "beat" => {
        "hostname" => "node03.test.org",
         "version" => "6.8.12",
            "name" => "node03.test.org"
    },
         "request" => "/test18.html",
           "input" => {
        "type" => "log"
    },
           "ident" => "-",
        "response" => "200",
     "httpversion" => "1.1"
}
提示:在node03的标准输出上能够看到我们刚才访问httpd的访问日志;
示例:配置filebeat将日志输出到elasticsearch

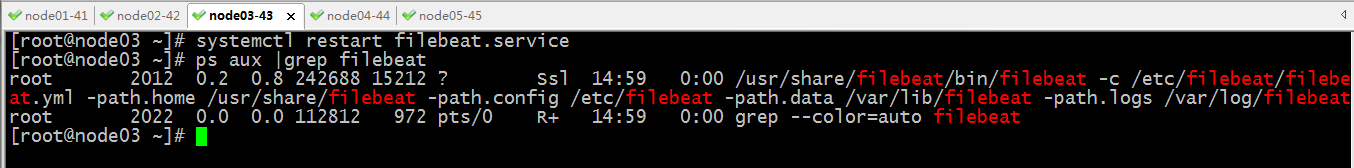
重启filebeat
验证:访问httpd看看elasticsearch中是否有保存httpd的访问日志?
在elasticsearch中查看是否有新的index生成?

提示:可以看到es上有一个新的index生成;
查看es上存储的日志内容
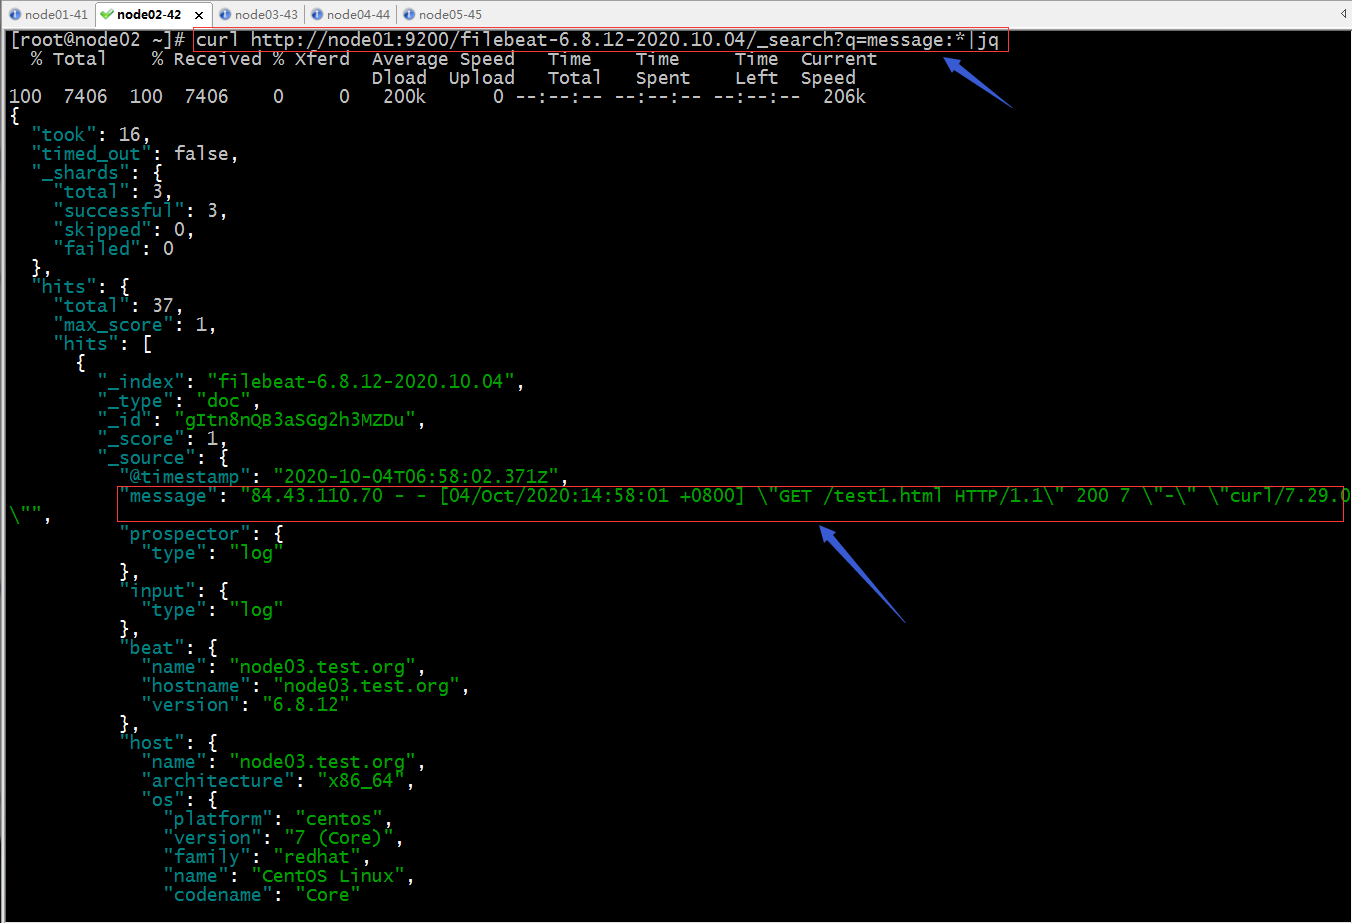
提示:从上面的返回的日志,存放在es中的日志并没有做拆分,说明filebeat只是把httpd的日志当作message字段的值处理,并没有去把ip地址信息做拆分;所以要想实现把日志内容拆分成不同字段,我们可以借助logstash,当然也可以在httpd上直接将日志格式记录为json格式,然后再由filebeat将日志信息传给es存储;
示例:配置filebeat将收集的日志信息输出到redis
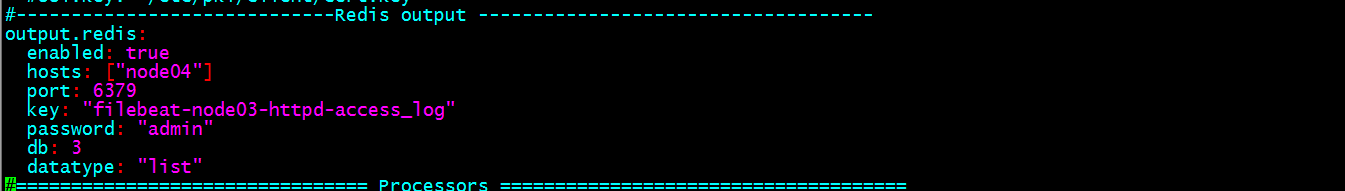
提示:以上配置是配置filebeat将收集到的日志输出到redis;这里需要注意一点,这个配置文件是yml格式的文件,需要注意下面的缩进关系要对其;其次filebeat它不支持多路输出,例如,配置filebeat 输出到logstash,又配置filebeat输出到redis,这个它不支持,它支持单路输出;
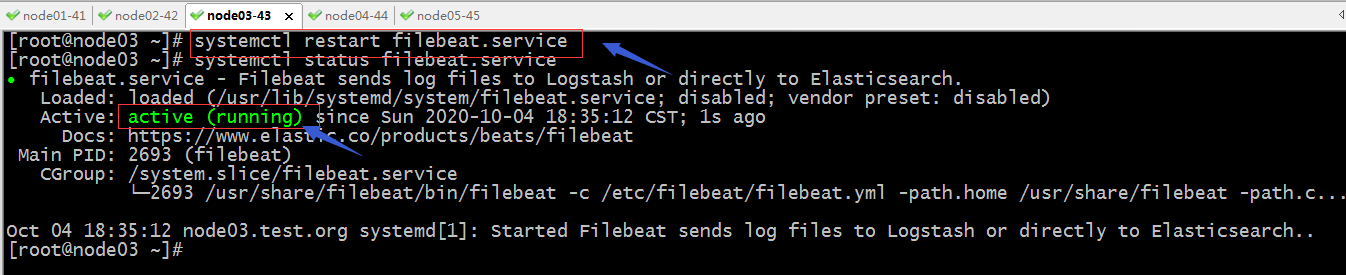
重新启动filebeat
用其他主机模拟访问httpd

验证:去node04上的redis 3号库查看是否有key生成?是否有数据?
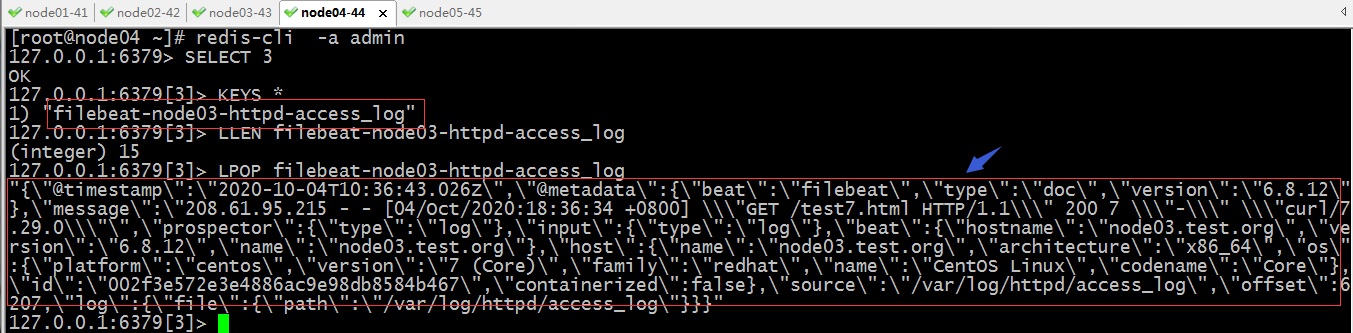
提示:可以看到此时redis的3号库有指定key生成,对应key里面也存了httpd的访问日志;
配置logstash到redis上读数据,并删除filebeat的冗余字段
[root@node03 ~]# cat /etc/logstash/conf.d/httpd-es.conf
input {
    redis {
        host => ["node04"]
        port => 6379
        password => "admin"
        key => "filebeat-node03-httpd-access_log"
        db => 3
        data_type => "list"
    }
}

filter {
    grok {
        match => {"message" => "%{HTTPD_COMBINEDLOG}" }
        remove_field => "message"
    }
    date {
        match => ["timestamp","dd/MMM/YYYY:H:m:s Z"]
        remove_field => "timestamp"
    }
    geoip {
        source => "clientip"
        target => "geoip"
        database => "/etc/logstash/geoip/GeoLite2-City.mmdb"
    }
    mutate {
        rename => ["geoip", "clientipInfo" ]
        remove_field => ["@metadata","prospector","input","beat","host","id","containerized"]
    }
}

output {
#    elasticsearch {
#       hosts => ["http://node01:9200","http://node02:9200"]
#       index => "httpd.log"
#       codec => "rubydebug"
#    }
    stdout { codec => "rubydebug" }
}

[root@node03 ~]#
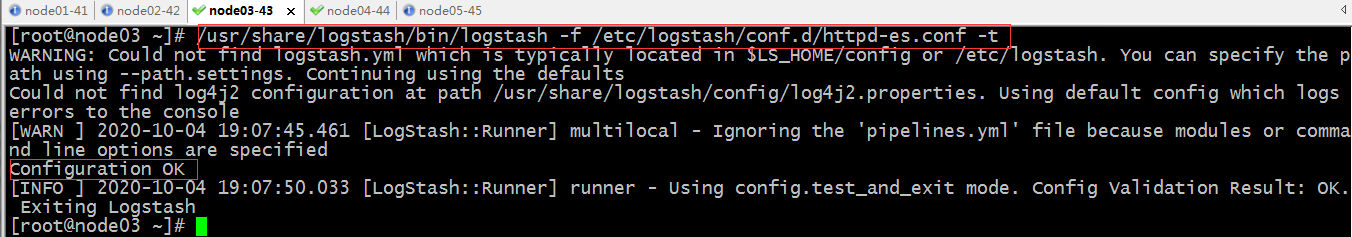
测试语法
启动logstash

查看输出到标准输出的日志信息是否还有filebeat生成的多余字段?
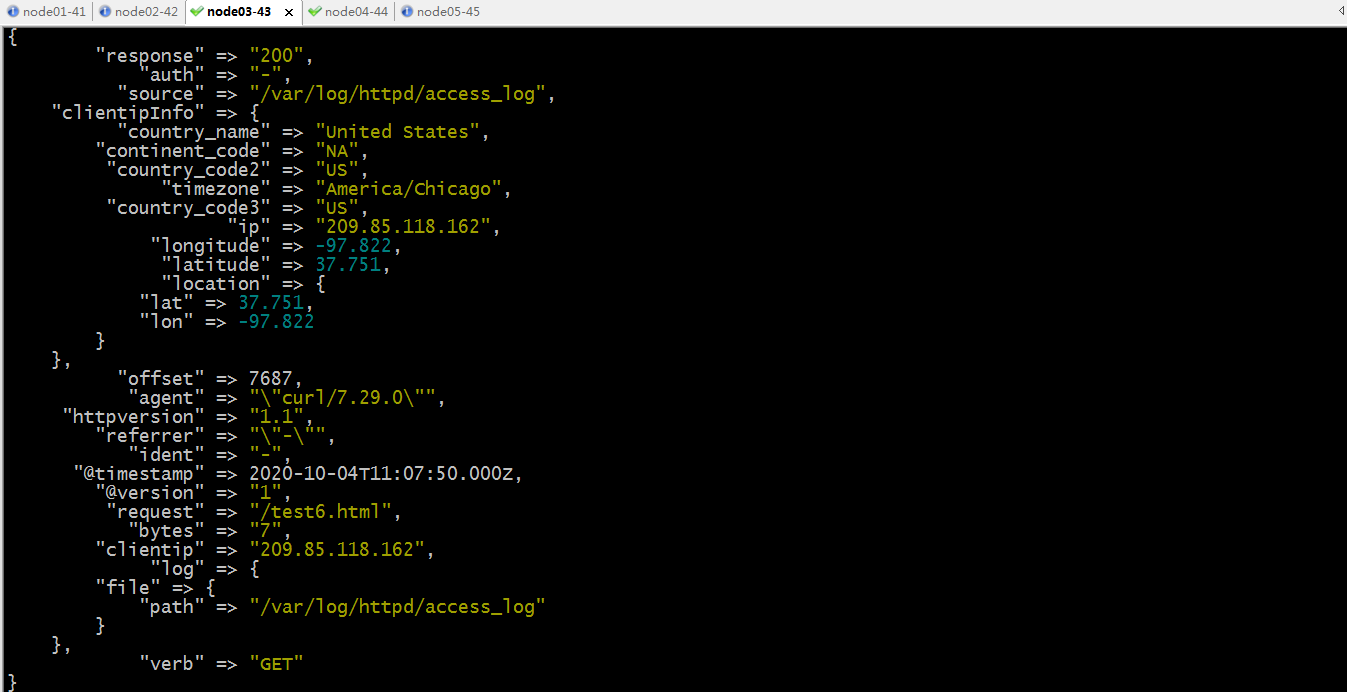
提示:现在从redis读出来的数据,然后经由logstash处理以后,filebeat生成的多余字段就删除了;后续我们就可以直接将这些日志数据放到es中存储;
Recommend
About Joyk
Aggregate valuable and interesting links.
Joyk means Joy of geeK