

Troubleshooting CPU Spike in a Major Trading Application - DZone Performance
source link: https://dzone.com/articles/troubleshooting-cpu-spike-in-a-major-trading-appli
Go to the source link to view the article. You can view the picture content, updated content and better typesetting reading experience. If the link is broken, please click the button below to view the snapshot at that time.

Troubleshooting CPU Spike in a Major Trading Application
In this article, we are going to discuss how we troubleshoot a CPU spike problem that surfaced in a major trading application in North America.
Join the DZone community and get the full member experience.
Join For FreeIn this article, we are going to discuss how we troubleshoot a CPU spike problem that surfaced in a major trading application in North America. All of a sudden, this application’s CPU started to spike up to 100%.
This team didn’t make any new code deployment, any environmental changes, they didn’t flip any flag settings – but all of a sudden the CPU started to spike up. We even validated whether there was an increase in the traffic volume, which was attributed to this traffic volume spike. But there was no increase in the traffic volume as well.
Data Capturing
This application was running on Java, Tomcat technology stack. We requested Site Reliability Engineering (SRE) team to capture the following two artifacts from the machine where this problem was happening:
- Top -H output
- Thread dumps
Let’s see what this artifact contains in this section.
1. Top -H
Always CPU spikes are caused because of threads. So we had to isolate the threads which were causing this CPU spike. This application has hundreds of threads. From these hundreds of threads, we need to identify the threads which are causing the CPU consumption to spike up? This is the first challenge.
This is where the ‘top’ Unix command-line utility tool comes handy. Most of you might be familiar with the ‘top’ Unix command-line utility. This tool shows all the processes that are running on the device. It also shows the CPU, memory consumed by each of those processes.
This tool has a secret ‘-H’ option :-), which a lot of engineers aren’t familiar with. It can be invoked like this:
$ top -H -p <PID>
Where PID is your application’s process Id. This application’s process ID is 31294. Thus the SRE team issued this command.
$ top -H -p 31294
When the ‘top’ tool is invoked with this ‘-H’ option, it will start to display all the threads that are running within that particular process. It will also display the amount of CPU and memory consumed by each thread within that process. Below is the output we got from this trading application:
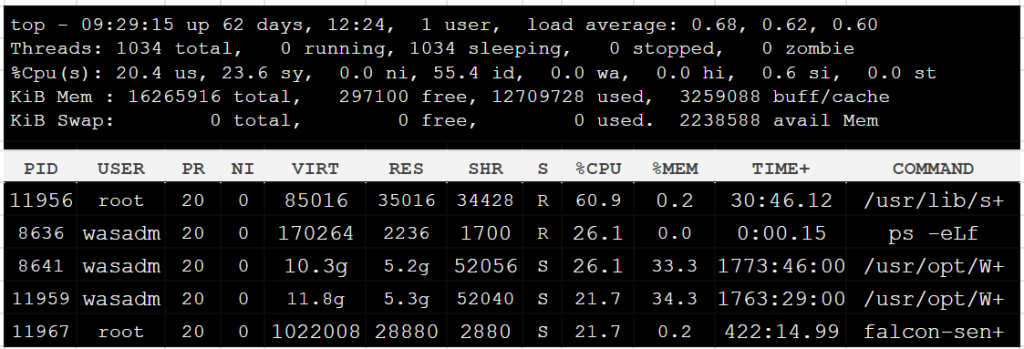
Fig: top -H -p {pid}
As you can see from the “top -H” output, there is a thread with id ‘11956’ in the first row. Just this thread alone is consuming 60.9% of the CPU. Bingo!! This is the first win. Now using this ‘top -H’ option, we have identified the thread which is consuming a high amount of CPU.
2. Thread Dumps
Our next challenge is to identify the lines of code that this ‘11956’ thread is executing. This is where thread dumps come handy. Thread dumps show all the threads that are running within the application and their code execution path (i.e. stack trace).
This blog highlights 8 different options to capture the thread dumps. You can use the option that is convenient for you. We used the ‘jstack’ tool which is part of the JDK to capture the thread dumps.
Best Practice: Capture at least 3 thread dumps, in a gap of 10 seconds between each thread dump.
Analyzing the Data
Now we uploaded both the ‘top -H’ output and ‘thread dumps’ to the fastThread tool. This tool can analyze thread dumps, and ‘top -H’ output and generate intuitive reports. This tool analyzed and generated this beautiful report.
This report contains the ‘CPU | Memory’ section. This is the section where the tool marries top -H output and thread dump and provides a CPU and memory consumed by each thread in the application.
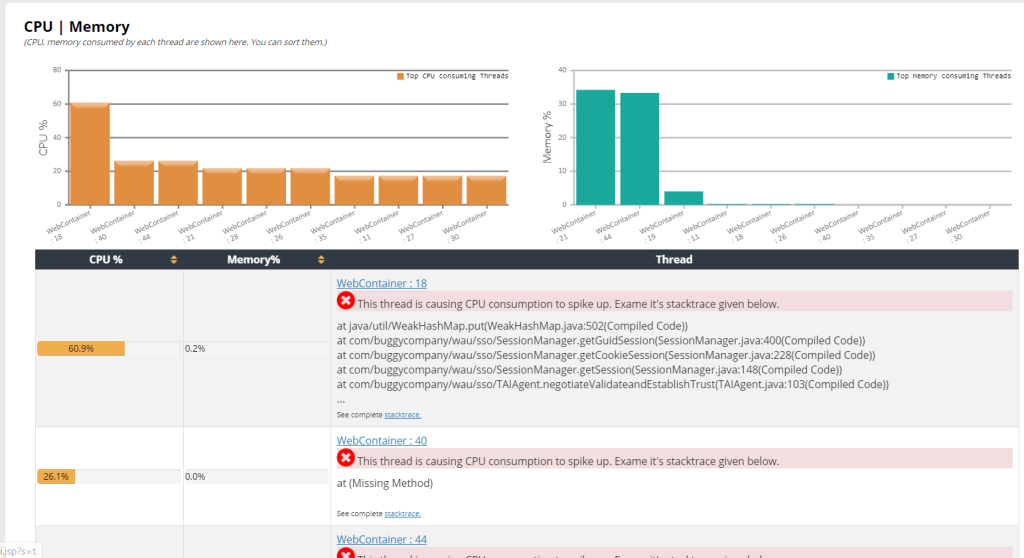
Fig: CPU, Memory consumed by each thread (generated by fastThread)
In the above screenshot, we can see the “WebContainer:18” thread in the first row reported to be consuming “60.9%” CPU. In the last column, you can see the code execution path (i.e. stack trace) of this thread. You can see the tool now reporting the thread name (i.e. ‘WebContainer:18’) and the code path that it was executing (which wasn’t available to us when we saw the raw top -H output).
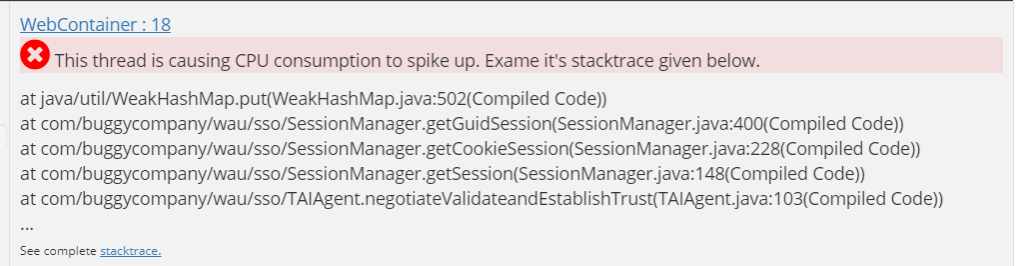
Fig: Stacktrace of high CPU consuming thread (generated by fastThread)
Resolution
You can notice that ‘WebContainer: 18’ thread was executing the java.util.WeakHashMap#put() line of code. For the folks, who aren’t aware, HashMap is not a thread-safe implementation. When multiple threads invoke HashMap’s get() and put() methods concurrently then it can result in infinite looping.
When thread loops infinitely CPU consumption will start to skyrocket. That’s the exact problem happening in this application. Once WeakHashMap was replaced with ConcurrentHashMap the problem got resolved.
We hope you find this simple technique useful.
Recommend
About Joyk
Aggregate valuable and interesting links.
Joyk means Joy of geeK