

Brief Introduction of Hamming and Hanning Function as The Preprocessing of Discr...
source link: https://www.tuicool.com/articles/reiQvi2
Go to the source link to view the article. You can view the picture content, updated content and better typesetting reading experience. If the link is broken, please click the button below to view the snapshot at that time.

Brief Introduction of Hamming and Hanning Function as The Preprocessing of Discrete Fourier Transform
Sep 29 ·5min read

The first question of most people is, why do we need preprocessing in Discrete Fourier Transform (DFT) or Fast Fourier Transform (FFT)? Before answering the question, you must know the difference between DFT and FFT. I have discussed the topic here before, you can check if you want to know more detail about the difference. The point is FFT is the fast way to do the DFT .
The answer is spectral leakage. What is spectral leakage? Spectral leakage is when you pass the ‘unfinished’ wave to the FFT. What I mean when I say the unfinished wave is the wave that has a non-integer period when it passed to FFT like this.

When you pass this signal to FFT, The result is like this

Woah, the power is very high, especially in 4 Hz band. It’s obvious because we passing a pure 4 Hz sine wave to the FFT. But looks like FFT ‘think’ our pure signal is a superposition of wave around 4 Hz .
The result will be different if you pass the ‘complete’ signal to the DFT. This ‘complete’ 4 Hz sine wave

when passed it to the FFT, the result will be like this

This is the expected result! Our input signal is 4 Hz sine wave so the frequency that has a power in the DFT spectrum plot is just 4 Hz. And the power shown is not too big as before. Since the python code is very sensitive with space and tab, I will just give you a GitHub link of the code here instead of showing it in here because all space and tabs will be messed up if I provide it here.
This phenomenon is called spectral leakage. It’s because DFT assumes our input signal is a ‘complete’ period signal . DFT assumes our signal is repeated exactly as the input . So when we passed the ‘incomplete’ version of 4 Hz sine wave, DFT will see it like this.

Let’s check the FFT output of that signal, here the result

It’s similar to the FFT output of the unfinished 4 Hz sine wave beforeisn’t? Yes, except in this extended version, the rising in power is higher (look at the y-axis scale). The code to do a plotting like the above graphs is through this link .
To clear the noise and get the ideal output (refer to “FFT of 4 Hz Sine Wave” plot) is we must know the period of the signal and cut it in the right timing (cut it exactly at the end of the period of the signal). But, in the real world, we don’t know about the period of the signal and also the real-world signal is full of noises and interferences so cut it in the right timing is impossible. The solution is a windowing function .
Windowing function in Fourier Transform is an attempt to adjust the beginning and end of our signal feeds to FFT is similar . In this story, we will cover 2 windowing function, Hanning Function, and Hamming Function.
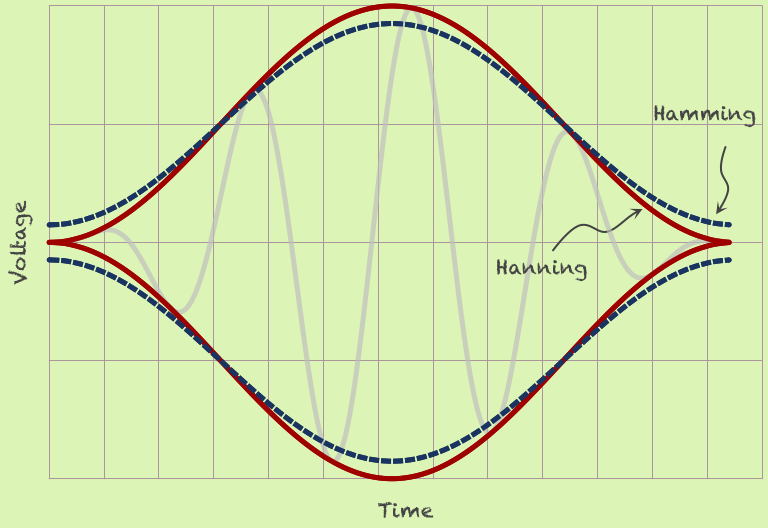
Hanning function is written like this

And Hamming function is this
Where M is the amount of data in the dataset input of FFT and n is a number from 0 to M-1.
So Hanning and Hamming will be outputting an array of number which is proportional to the number of data in the dataset. If we plot the output of Hanning and Hamming function, we will get 2 graphs like these


Here is the link of code to create the plot above.
To adjust the signal, we multiply the signal against the output of Hann and Hamm . As an example, we multiply our unfinished 4 Hz sine wave against Hann and Hamm, and then the shape of our wave will be like these.


Let’s processed to the FFT and we will get graphs like these.


Look, the power of wrong band in the FFT is decreased (include the right band, it’s approaching the ‘right’ value). We can see that the power in the wrong bands not totally eliminated, it just can be decreased . There is no real difference between Hamming and Hanning function if we look at the result of FFT in this experiment. And here the link of code to create the plot of signal processed by Hanning/Hamming function and the result of their FFT.
One important point is, You can see that with or without processed by a windowing function, the most dominant frequency in the FFT plot is always the same , 4 Hz. So, if you just want to know what is the dominant one frequency in your signal, I think you don't need a windowing function . When you want to find more than 1 dominant signal in your dataset, I think these windowing function will be a huge help since when there is a leakage, the power of some bands around the dominant signal can overshadowing a second or third or etc signal you want to find. And of course, you will need a windowing function if you want to smooth the result of FFT.
references:
https://www.crystalinstruments.com/dynamic-signal-analysis-basics , accessed on 29 September 2019
Recommend
About Joyk
Aggregate valuable and interesting links.
Joyk means Joy of geeK