

Observability Without Having to Break the Bank
source link: https://www.tuicool.com/articles/hit/ZB3eQnN
Go to the source link to view the article. You can view the picture content, updated content and better typesetting reading experience. If the link is broken, please click the button below to view the snapshot at that time.


To run a serverless application in production reliably, you need to be able to debug issues quickly. You need to have good observability, and having structured logs is a big part of that. They allow you to capture useful contextual information with each log message.
But observability comes with a cost.
The Problem
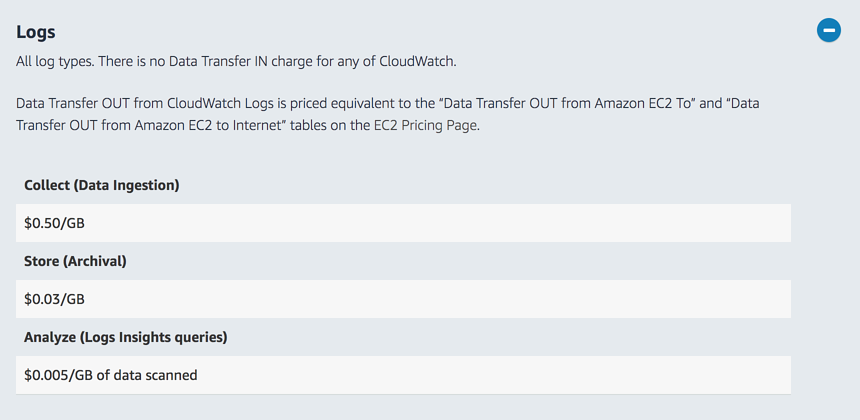
CloudWatch Logs charges $0.50 for per GB of data ingested, and $0.03 per GB per month for storage. As such, it’s common for companies to spend more on CloudWatch Logs than Lambda invocations in their production environment. Best practices such as using structured logs further exasperate the cost associated with logging.

Furthermore, with AWS Lambda, it’s no longer possible to rely on agents to collect and publish observability data such as custom metrics and traces. Instead, you have to either:
- publish data synchronously as part of a function invocation
- publish data asynchronously through CloudWatch Logs
Publishing data synchronously adds latency to your invocation. When it comes to APIs this extra latency becomes user-facing and negatively impacts your user experience. Which is why it’s generally recommended that you collect observability data for APIs asynchronously. However, collecting data through CloudWatch Logs further adds to its cost.
In this post, we’ll see how we can use sampling to address this cost concern, and check out the built-in sampling support in Thundra.
Sampling to the rescue
If the primary reason why we needed observability in the first place is to help us debug issues in production. And if most requests are processed successfully, then it stands to reason that we should:
- Collect data for all erroneous or poor performing invocations. Because they represent invocations that require our attention.
- Collect data for a small percentage of successful invocations. So that we always have some representation of what a “good” invocation looks like.
In the most naive approach, we can also sample data from a percentage of all invocations irrespective of their outcome or performance. That way, we can reduce the cost of logging while still maintaining the same distribution of good and bad invocations.
With a sufficient number of invocations, you only need a small percentage of them to have representative data for every scenario. Indeed, the industry average is to sample 1% of all requests. The likes of Google would sample at 0.01% because their scale is so big that even 0.01% of requests would give you good representation for every scenario.
Intelligent sampling with Thundra
Thundra supports both synchronous and asynchronous modes of collecting data. But collecting data asynchronously requires you to send a lot of data to CloudWatch Logs. By default, Thundra records at least seven pieces of data for every invocation (see below).

That is a total of 16KB of observability data for every invocation! It undoubtedly is a cost concern when running at scale. So I’m really glad that Thundra recently announced sampling support.
Sampling metrics
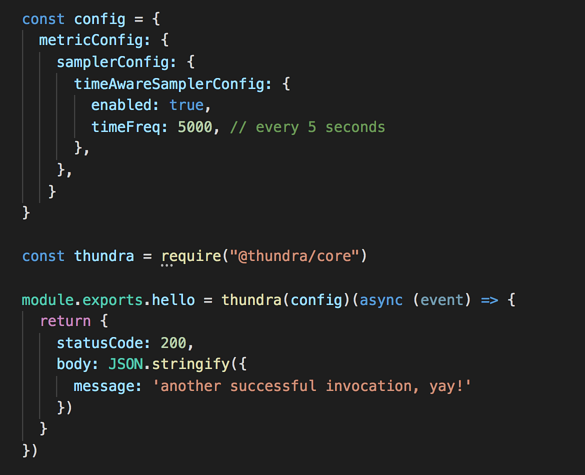
For metrics, you can use the count aware sampler to do simple percentage-based sampling. What’s more interesting though, is the time aware sampler . It allows you to sample metrics based on a configured frequency.
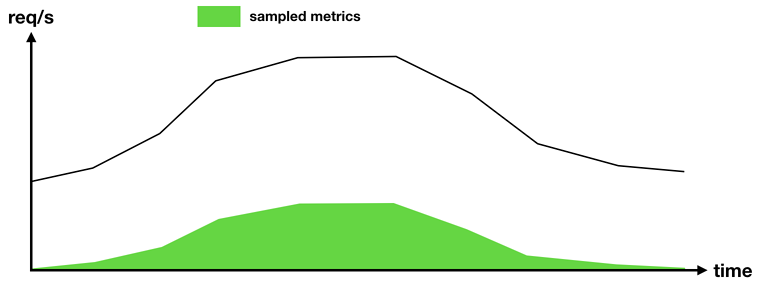
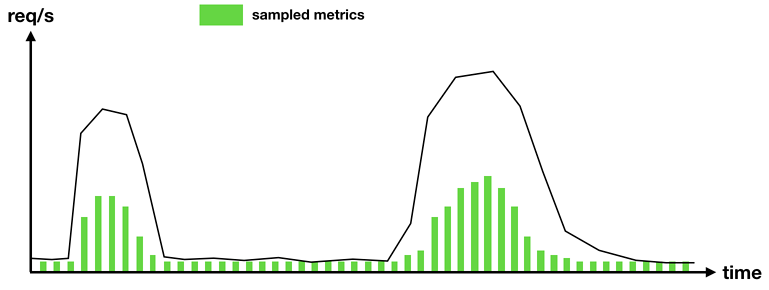
Percentage-based sampling works well when you have stable, predictable traffic. All the way throughout the day, you will have metrics for a percentage of invocations.

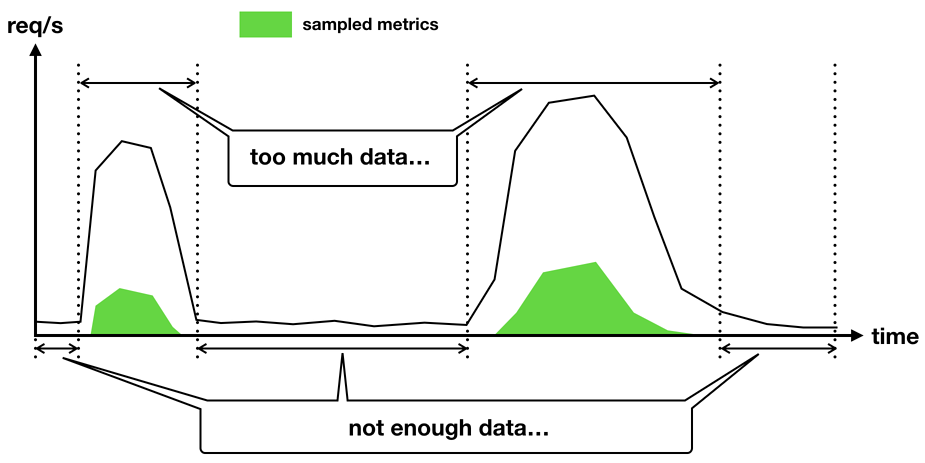
But it doesn’t work well for functions that run in bursts. If a function runs infrequently and we only collect metrics on 1% of its invocations, then there will be large gaps in time where we don’t have any metrics at all. Conversely, if this function sees a sudden burst of activities, we will collect lots of metrics during that burst. However, since all the metrics relate to the same burst of activities, they are bound to be similar too. Which means their signal-to-noise ratio is low.

The time-aware sampler solves this because when the function runs infrequently, it’ll simply record metrics for every invocation. When the function sees a burst of activities, it’ll also not record too many metrics either.

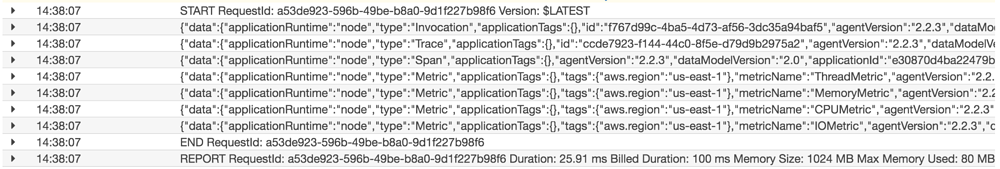
Take the following function as an example, it’ll record metrics every five seconds.

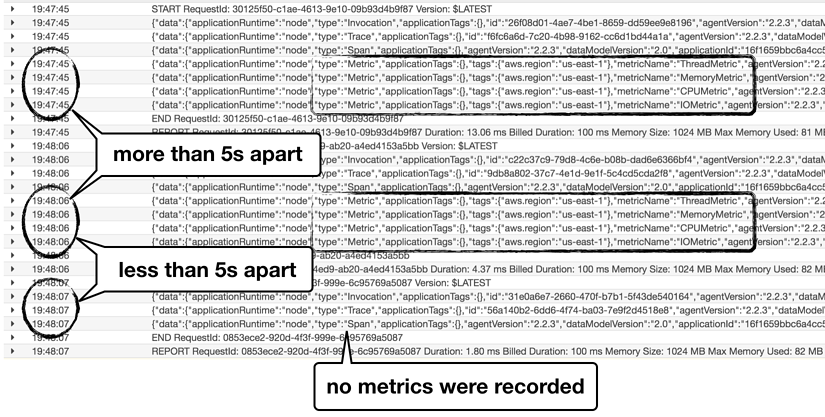
You can see from its logs that invocations that are less than 5s since the last sampled metric would not record metrics.

Sampling traces
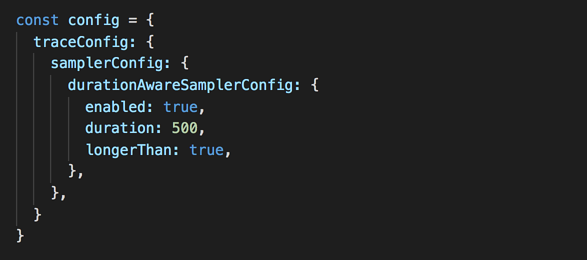
For traces, you can enable sampling based on the duration of invocations as well as whether they ended in an error state.
For example, the following configuration would sample trace data only when the duration of an invocation is over 500ms. That is, “show me the breakdown of where invocation time was spent if the function is slow”.

Again, if you look at the logs for this function. You will see an entry with type “Span” only when the invocation duration was over 500ms.

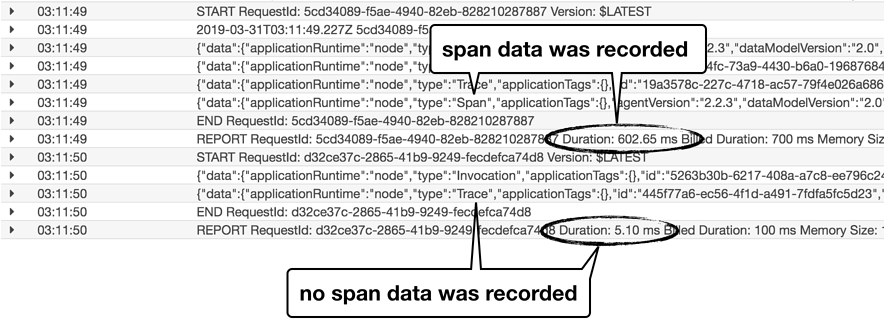
Similarly, the following configuration would sample traces only when the invocation errors.

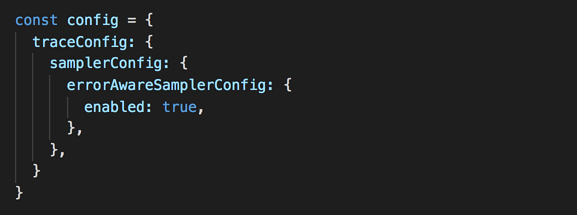
As discussed earlier, both of these sampling options are great for improving the signal to noise ratio. Since detailed traces are most useful when something has gone wrong. Either the invocation was slow and we need to investigate where the performance issue is. Or the invocation erred and we need to find out where did the error occur.
However, I would still like traces to be sample even when everything is working normally. That way, I can have a sample of healthy invocations that I can use as a reference.
Besides the sampling methods we discussed here, you can also write custom samplers for both metrics and traces. You can also configure samplers through environment variables too. For more information on the sampling support, check out the official documentation page .
Summary
In this post, we explained the problem that you can sometimes spend more on observing your production system than the system itself. Sampling is a common solution for addressing this cost concern while still giving you the observability you need.
We then looked at the new tracing support that was recently added to Thundra. You can sample metrics and traces using a number of built-in samplers:
These samplers can help reduce the cost of observing your production system significantly. But there’s still room for further improvement as we discussed some ways Thundra can cut down on the cost of observability even further.
Recommend
About Joyk
Aggregate valuable and interesting links.
Joyk means Joy of geeK