

Build an Air Quality Monitor with InfluxDB, Grafana and Docker on a Raspberry Pi
source link: https://www.tuicool.com/articles/hit/JvMN3qI
Go to the source link to view the article. You can view the picture content, updated content and better typesetting reading experience. If the link is broken, please click the button below to view the snapshot at that time.

Have you ever been interested in monitoring the air quality in your home or outside where you live and work? This project, which we’ve dubbed balenaSense , will get you up and running with a setup to take readings of temperature, humidity, barometric pressure, and air quality, and provide a dashboard that you can access from anywhere to see the stats at a glance and monitor trends.
![]()
Table of contents
- Putting the hardware together
- Setting up the Raspberry Pi
- Deploying the software
- Viewing the dashboard
Introduction
Building an air quality & weather station used to involve a lot of wiring and different sensors, but with the advent of sensors that combine all the readings into one component on a nice little breakout board, it’s easy to get started.

We’re going to look at monitoring temperature, humidity, barometric pressure and air quality using an all-in-one sensor that connects directly to a Raspberry Pi with no additional components required. You don’t need any experience in electronics but a soldering iron would be handy (although not required). This project implements a database to store historic readings along with a graphical interface to see current readings and trends at a glance.


Hardware required
Here’s the shopping list for this project. Depending if you’d like to crack out the soldering iron or not will dictate what sensor board you can use; some are plug and play, some require a little soldering.

I don't want to solder
If you don't want to solder, you'll need:
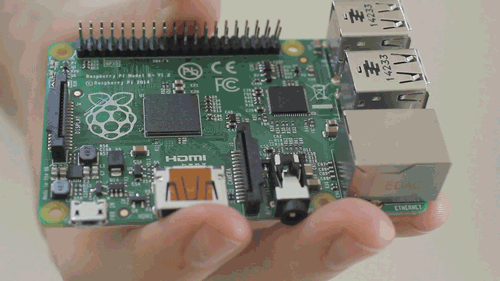
- Raspberry Pi Zero WH (also works with 2Bv1.2/3B/3B+/3A+)
- 8GB (or larger) Micro-SD Card (we recommend Sandisk Extreme Pro SD cards)
- Power supply & cable
- Pimoroni BME680 sensor with breakout board
- Pimoroni breakout garden pHAT
I want to solder - let me at it!
If you're happy doing a little soldering, you'll need:
- Raspberry Pi Zero W (also works with 2Bv1.2/3B/3B+/3A+)
- 8GB (or larger) Micro-SD Card (we recommend Sandisk Extreme Pro SD cards)
- Power supply & cable
- Bosch BME680 sensor with breakout board (see alternatives below)
- Connection wire
Other sensors
If you already have one, this project also supports the use of the Sense HAT , with the added bonus that you'll get a smiley face showing on the LED matrix (depending on the air quality, of course)!

You can get hold of the Bosch BME680 sensor on a breakout board from a variety of vendors too, all at varying costs.
- Pimoroni BME680 breakout £18.50 (can be solder-free with their pHAT )
- Adafruit BME680 breakout US$22.50
- Sparkfun SparkX BME680 US$19.95 (can be solder-free with their HAT )
- Unbranded BME680 breakout US$9.92
Note:The Pimoroni breakout board is the one we’ve used in this article; this board has the added benefit that the pins are broken out in the correct order to just plug straight into the Raspberry Pi GPIO header. When using other boards you’ll need to be careful to ensure the pins for power, ground and the I2C bus (SDA and SCL) are matched - this is explained further on in the guide.
Software required
We’ve set up the balena-sense project on GitHub which contains all of the software, configuration and code you’ll need to start taking readings straight away. We’re going to deploy this project on balenaCloud using a free account to push the project and all the software to your Raspberry Pi as well as to provide remote access. Therefore, you’ll need:
- Tool to flash your SD card, such asbalenaEtcher
- A free balenaCloud account
- A clone or download of our project from GitHub
Putting the hardware together
You’ve got very little to do on the hardware front for this project; our goal here is to connect the sensor board you purchased to the Raspberry Pi general purpose input/output (GPIO) header.
The BME680 sensor communicates with the Raspberry Pi over a bus called I2C (eye-squared-see), which is a serial communication bus that requires 2 wires. These two communication wires are referred to as serial clock (SCK) and serial data (SDA). In addition to the two communication wires, we also need to provide the sensor with power (3.3V, or 3V3) and ground.
If you went for the solder-free option from Pimoroni or Sparkfun, or are using the Sense HAT, you’ll just have to plug your shiny new components together along with your Raspberry Pi, and all of the connections will be made for you - go forth, to the next step!
If you decided to connect a sensor directly to your Raspberry Pi, either the Pimoroni one or any one of the other breakout boards from one of the other suppliers, the main things to watch out for are that the pins described above (SDA, SCK, 3V3 and GND) are correctly connected.

A useful site for working with the GPIO header on your Raspberry Pi is pinout.xyz ; it clearly shows us that the pins we need are 1 (3V3 power), 3 (SDA), 5 (SCL), and 9 (Ground). The 40 pin GPIO header is standard across the Pi 2 and later. You’ll notice that if you’re using the Pimoroni board and solder on the included header, the pins are in exactly the right order to connect the boards together. Notice how the writing on the board matches the pins in the pinout diagram above.

However, if you connect the sensor like this you may find the readings are affected by the heat from the Raspberry Pi CPU; more accurate readings can be taken by extending the sensor away from the board, which can be achieved using male-to-female Dupont cables (or Jumper Jerky ), as below:

Similarly, if you’re using one of the other sensors where the pinout diagrams do not match exactly, you can connect these boards to your Pi using the same method, ensuring that you match up 3V3, SDA, SCL, and GND. Your board may also have pins for SDI, SDO, CS - you can ignore these and leave them unconnected as they’re used for an alternative serial peripheral interface (SPI) to the sensor which we’re not using in this project.
In the photos above we’re using a Raspberry Pi 3A+, but you can use a Pi Zero as pictured at the start of the guide for a lower cost solution.
Setting up the Raspberry Pi
We’re going to flash an SD card with balenaOS via a download from the balenaCloud dashboard and add the device in order to push the project, and set things up in such a way it can easily be updated later.
The first thing to do is to get set up with a balenaCloud account; this means signing up if you haven’t already, adding an application and adding a device.
Step 1 - Sign up to balenaCloud
The first thing you’ll need to do is sign up for an account . If you’ve already got a GitHub or Google account you can use that to login and bypass the signup process.
Step 2 - Create an application
Add an application selecting the correct device type for the device you’re using, and choosing Starter
as the application type, then hit Create New Application
. Using the starter application will provide you with all of the features of the microservices application and is free up to and including your tenth device.
This will take you to the dashboard for your newly created application, where you can move on to the next step and add your device. The name you give your application is up to you, but you'll need it later on in the guide when you push your code.
Step 3 - Add a device and download the OS
Once your application has been created, you can setup and add a device within that application by clicking the green 'add device' button. When you add a device you specify your device type, which is important that it matches the device you’re using, and if you are connecting to a wireless network you can set your WiFI SSID and passphrase here too.
This process creates a customized image configured for your application and device type and includes your network settings if you specified them.
Note:When you're first getting started, a development image will be most useful, as it permits a number of testing and troubleshooting features. More details on the differences between development and production images can be foundhere. If you're confident you can go ahead and deploy the production image straight away -- that's what I'm running.
Step 4 - Flash your SD card and boot the device
Once the OS image has been downloaded, it’s time to flash your SD card. You can usebalenaEtcher for this.

Once the flashing process has completed, insert your SD card into the Raspberry Pi and connect the power supply.
When the device boots for the first time, it connects to the balenaCloud dashboard, after which you’ll be able to see it listed as online and move onto the next step.

Troubleshooting:It should only take a few minutes for the new device to appear in your dashboard, If your device still hasn't shown up on your dashboard after a few minutes, something has gone wrong. There's an extensive troubleshooting guide in the documentation, with lots of information on why this could be, but if you still can't get your device online, come on over tothe forums where we’ll be able to help out.
Deploying the software
Now that your Raspberry Pi has been provisioned, has booted, and connected to balenaCloud, you're ready to push the application code to the device.
Installing the balena CLI tools
If you already have (or can setup) npm on your machine, this is most likely the easiest way to get the CLI tools up and running quickly. However, there are also standalone binaries for Windows, macOS and Linux available . Note: if you've already installed these tools to complete another of our projects, you don't need to do this part again - skip directly to the next step.
The documentation for the CLI tools is the best place to start and covers the installation and setup of both the npm package and the standalone binaries.
When you have the CLI installed and working, the first step is to login to balenaCloud by issuing the balena login
command:


Once you’ve reached this point, and have a working CLI which has been logged in to your account, you're ready to start pushing code to your Raspberry Pi.
Downloading the project from GitHub
The next step is to download the code for this project from GitHub. Go to: https://github.com/balena-io-projects/balena-sense/ and download the project.
The blue button will download a .zip file of the project which you'll need to unzip, but if you're already familiar with Git you can use git clone
in the normal way.
Pushing the project code to your Raspberry Pi
As you have the CLI setup and the latest code downloaded, you can now execute a single command to push that code to balenaCloud which in turn builds the Docker image and handles the process of setting it up and running it on your device.
From within the unzipped project directory, execute balena push <appName>
, where appName is the application name you set back at the beginning of the guide. For example: balena push balenaSense
.
If everything worked out correctly, after a few minutes your device information screen in the dashboard should look something like this, showing the services running, one for each of the software components.

When you push the code for the first time it can take a few minutes to download (dependant on your internet connection speed) but after that, only the changes in the container are downloaded so things happen much quicker.
Note:that when the application first starts (and you're using the BME680 rather than the Sense HAT) the sensor performs a ‘burn-in’ over a 5-minute period. Readings will not be taken and readings not inserted into the database during this period. The application will log a countdown, which you can see within the balenaCloud dashboard as per the below screenshot:

After the countdown has reached zero, you’ll see a message that says ‘Starting loop…` and readings will now be taken and inserted into the database every 10 seconds.
Viewing the dashboard
Hopefully you got your device flashed, connected to your network and up and running without too much trouble. One of the great benefits of using a free balenaCloud account is that you’re able to use the Public Device URL
feature.

Enable this toggle on your device and click the blue arrow to access the dashboard; you can share this link or bookmark it for use from your phone or another mobile device. As long as your balenaSense device is online and working, you’ll be able to access your dashboard from anywhere!

If you don’t want to enable the public device access, you can still view the dashboard from within your own local network by using the IP address value from the image above. Yours will be different, but if you enter http://<ip address>
into a browser, you’ll still be able to access the dashboard as long as you’re on the same network as the device. For example, to access my device I would use http://10.1.231.36
.
If you'd like to log in to Grafana and start playing with the settings, the default credentials are admin
and admin
.
How does it work?
This project has 3 main components, which are separated into 3 services. These are the names of the services you’ll see on your balenaCloud dashboard:
- InfluxDB - A database, used for storing sensor readings
- Sensor - The Python library and code for accessing the sensor, taking readings and saving them in the database
- Grafana - Used for creating a dashboard with graphs & reports
The BME680 sensor from Bosch gives us readings for temperature, humidity, pressure and a gas content reading provided in terms of resistance. The sensors for temperature, humidity, and pressure give us useful readings out of the box, but the gas resistance reading on its own is not a lot of use. It gives us an indication of the change in compounds in the air, so when the sensor application starts, it sets a baseline and monitors change. The indicative air quality reading is given in percentage and takes into account the effect of humidity and gas reading.
If you're using the Sense HAT, which doesn't have a gas sensor, we've approximated the air quality reading using target values for temperature and humidity.
What next?
So by now hopefully you’ve got the project fully up and running, have accessed the dashboard and have been taking readings and filling up your database. Here are a few more things to take a look at before you move on to the next project.
Change the password
If you’re leaving your device publically accessible, it’s a good idea to change the password for Grafana.

We’ve set the system up with a default username and password of admin
and admin
. You can change this by logging into Grafana using the button in the lower left corner of the dashboard; you’ll be prompted to change it upon first login.
Customization
The dashboard & reporting software we’re using, Grafana, has a lot of configuration options and settings for you to play with. We’ve set up a basic dashboard that gives you a gauge and a graph for each of the 4 readings that we’re taking.

You can customize each panel on Grafana after you’ve logged in by hovering over the title and going to edit. I recommend having a play with the options - the changes to your dashboard are not saved automatically so if you make a mistake you can reload the page and everything will revert to how it was. If you make some changes you want to keep, hit save at the top of the dashboard and all of your settings will be saved to your device.

You can customize the gauges too; for example on the pressure gauge, we’ve set up some basic bands and text values to replace the numbers. You’re free to edit all these to whatever works for you!
Build a housing
Sensors like this ideally like to be housed in a radiation shield (sometimes called a Stevenson Screen ), to prevent sunlight and radiated heat affecting the readings. If you’re monitoring the environment indoors, it isn’t quite so critical, but if you’re monitoring outdoors, positioning and protecting the sensor is important to get accurate readings.
Commercial radiation shields are available, such as this one from Davis , but can be quite expensive, so there are DIY options around too.
There are a few different options for BME680 housings and Stevenson screens on Thingiverse; take a look and see if any of the designs will work for your application.
Final thoughts
Thanks for reading! If you decided to build your own air quality monitor, we’d love to hear how it went, similarly if you got stuck, have any questions or just have some suggestions for future development of the project, let us know in our forums at https://forums.balena.io , on Twitter @balena_io , on Instagram @balena_io or on Facebook .
Recommend
About Joyk
Aggregate valuable and interesting links.
Joyk means Joy of geeK