62

10 Years of Chrome DevTools

 6 years ago
source link: https://chinagdg.org/2018/09/10-years-of-chrome-devtools/
Go to the source link to view the article. You can view the picture content, updated content and better typesetting reading experience. If the link is broken, please click the button below to view the snapshot at that time.
neoserver,ios ssh client

10 Years of Chrome DevTools

2018-09-07adminGoogleDevFeedsNo comments

Source: 10 Years of Chrome DevTools from Chromium

* { line-height: 1.38 !important; white-space: initial !important; } ul { font-size: 11pt !important; } li { line-height: 1.38 !important; } img { margin-bottom: 0 !important; } i { text-align: center !important; }

Chrome is turning 10! Thank you for making the web development community so open, collaborative, and supportive. DevTools draws inspiration from countless other projects. Here’s a look back at how DevTools came about, and how it’s changed over the years.

In the beginning, there was Firebug

Imagine for a moment that browsers didn’t ship with developer tools. How would you debug JavaScript? You’d basically have 3 options:
  • Sprinkle window.alert() calls throughout your code.
  • Comment out sections of code.
  • Stare at the code for a long time until the JavaScript gods bless you with a solution.
What about layout issues? Network errors? Again, all you could really do is conduct painstaking experiments in your code. This was the reality of web development up until 2006. Then a little tool called Firebug came along and changed everything.

A screenshot of Firebug’s Net panel, taken from Saying Goodbye to Firebug (source and license)

Firebug was a Firefox extension that let you debug, edit, and monitor pages in real-time. As a web developer suddenly you went from having no visibility into your pages to having what are essentially the core features of modern developer tools. The ability to understand exactly why Firefox was behaving as it was unleashed a flood of creativity on the web. Without Firebug, the Web 2.0 era wouldn’t have been possible.

WebKit Web Inspector

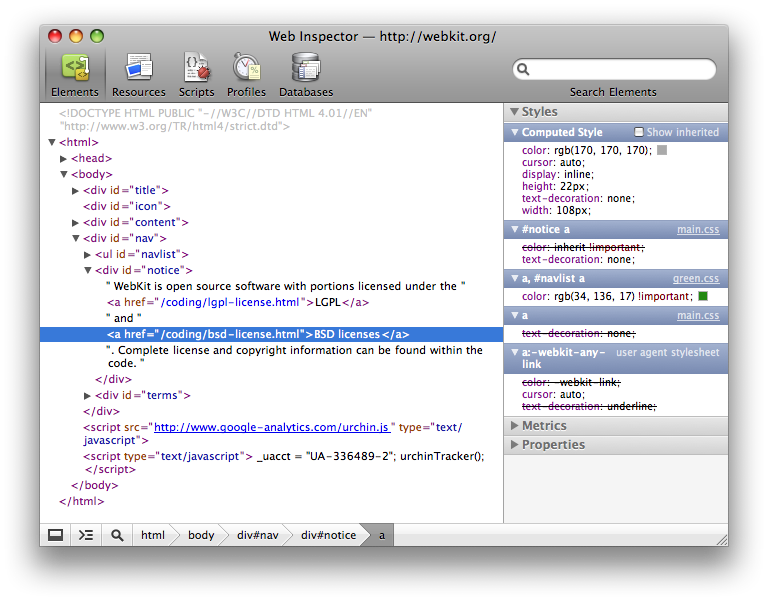
Around the same time as Firebug’s launch, a few Google engineers started working on a project which would eventually lead to Chrome. From the start, Chrome was a mashup of different code libraries. For rendering the Chrome engineers opted for WebKit, which is the open-source project that still powers Safari to this day. An added bonus of using WebKit was that it came with a handy tool called the Web Inspector.

A screenshot of the Web Inspector, taken from Web Inspector Redesign (source and license)
Firebug was a Firefox extension that let you debug, edit, and monitor pages in real-time. As a web developer suddenly you went from having no visibility into your pages to having what are essentially the core features of modern developer tools. The ability to understand exactly why Firefox was behaving as it was unleashed a flood of creativity on the web. Without Firebug, the Web 2.0 era wouldn’t have been possible.


The “Inspect Element” era


Chrome brought many innovative ideas to the browser ecosystem, such as the omnibox that combined search and the address bar, and a multi-process architecture that prevented one hanging tab from crashing the entire browser. But the innovation we like the most was providing developer tools in every build to every user, exposed with the click of a mouse.
“Inspect Element” in 2010

Before Chrome, developer tooling was an opt-in experience. You either had to install an extension, like Firebug, or enable some flags, as is still the case in Safari today. Chrome was the first browser to make developer tooling accessible from every browser instance. We’d like to claim that we had a grand vision for creating a developer-friendly browser from the start, but the reality is that Chrome had a lot of compatibility issues in its early days (which makes sense, since no one was building for it) and we needed to give web developers an easy way to fix these issues. Web developers told us that it was a useful feature, and we kept it.


The mobile era

For the first few years of the DevTools project, we essentially added chapters to the stories that Firebug and Web Inspector started. The next big shift in how we approached DevTools happened when it became clear that smartphones were here to stay.
Our first mission in this brave new world was to enable developers to debug real mobile devices from their development machines, which we call remote debugging. DevTools was actually well-positioned to handle remote debugging, thanks to another consequence of Chrome’s multi-process architecture. Early on in the DevTools project we realized that the only way a debugger could reliably access a multi-process browser was through a client-server protocol, with the browser being the server, and the debugger being the client. When mobile Chrome came around, the protocol was already baked into it, so we just had to make the DevTools running on your development machine communicate with the Chrome running on your mobile device over the protocol. This protocol still forms the backbone of DevTools today, and is now known as the Chrome DevTools Protocol.
Remote Debugging
Remote debugging was a step in the right direction, and to this day is still the primary tool for making sure that your sites behave reasonably on real mobile devices. Over time, however, we realized that remote debugging could be a bit tedious. When you’re in the early phases of building out a site or feature, you usually just need a first-order approximation of the mobile experience. This prompted us to create a set of mobile simulation features, such as:
Precisely emulating the mobile viewport, simulating touch-based input and device orientation. Throttling the network connection to simulate 3G and CPU to simulate less-powerful mobile hardware. Spoofing user agent, geolocation, accelerometer data and more.
We collectively refer to these features as Device Mode.

An early prototype of Device Mode

Device Mode in 2018

The performance era

While the mobile era unfolded, big apps like Gmail were pushing the limits of the web’s capabilities. Gmail-scale bugs called for Gmail-scale tools. One of our first major contributions to the tooling ecosystem was to show a play-by-play breakdown of exactly everything that Chrome had to do in order to display a page.
The original Timeline panel, as announced in Do More with Chrome Developer Tools
The Performance panel in 2018

These tools were a step in the right direction, but in order to spot optimization opportunities you needed to learn the nitty-gritty details about how browsers work and sift through a lot of data. Lately we’ve been building on this foundation to provide more
guided performance insights. The new Lighthouse engine powers the Audits panel, and is also available as a Node module for integration with CI systems.
Performance suggestions in the Audits panel


The Node.js era

Up until 2014 or so, we mainly thought of DevTools as a tool for building great experiences on Chrome. The rise of Node prompted us to rethink our role in the web ecosystem.
For the first few years of Node’s existence, Node developers were in a situation similar to that of web developers before Firebug, or Gmail developers before the Timeline panel: the scale of Node apps outpaced the scale of Node tools. Given that Node runs on Chrome’s JavaScript engine, V8, DevTools was a natural candidate to fill the gap. Support for debugging Node with DevTools landed in 2016 and includes the usual DevTools features, such as breakpoints, code stepping, blackboxing, source maps for transpiled code, and so on.

Node Connection Manager


The DevTools protocol ecosystem

The name Chrome DevTools Protocol (CDP) suggests an API that only DevTools can use. The reality is more general than that: it’s the API that enables programmatic access to Chrome. Over the last few years, we’ve seen a few third-party libraries and applications join the protocol ecosystem:

chrome-remote-interface provides low level JavaScript access to the protocol
Puppeteer brings it to the next level of abstraction and enables automation of the evergreen headless Chrome browser with modern JavaScript API
Lighthouse automates the process of finding ways to improve the performance and quality of pages
We’re excited to see thousands of projects depend on these packages to enable rich interaction with Chrome. If you’re in the tooling or automation business, it’s worth checking out the protocol to see if it opens up any opportunities in your domain. For example, the VS Code and WebStorm teams both use it to enable JavaScript debugging within their respective IDEs.


What’s next?

Our core mission is to build tools that help you create great experiences on the web. We very much rely on your feedback to help us determine what products or features to build.

Stay up-to-date on new features with our What’s New posts
Propose new features on the mailing list
Follow us on Twitter to discover new features and bite-sized workflows
Ask questions on Stack Overflow to get help with using DevTools
Take matters into your own hands and contribute to DevTools
Thank you for creating such a vibrant community. We look forward to another 10 years of building the web with you.
Posted by the Chrome DevTools team

About Joyk


Aggregate valuable and interesting links.
Joyk means Joy of geeK